Shader Source Debugging in the Vulkan Scene Graph
The Vulkan Scene Graph recently acquired support for source-level debugging of shaders when running a program with RenderDoc. Incidently, if you do 3D graphics programming and don’t know RenderDoc, you need to. It will make all your dreams come true. Perhaps I exaggerate, but it provides a level of introspection that was unimaginable a few years ago. This is a quick walkthrough of how to enable shader source debugging in a VSG application and then debug a shader in RenderDoc. Click on a screenshot image to see a full-size version.
The application
Shader source debugging works a bit like debugging a C++ program: the
source code is made available to the debugger, and the executable code
is annotated with symbols that describe how it corresponds to the
source. There’s no global or command line option in the VSG for
enabling source debugging, so your application must choose the option
when creating a vsg::ShaderSet. Here’s the code that does this in
vsgCs:
 vsg::ref_ptr<vsg::ShaderSet> makeShaderSet(const vsg::ref_ptr<const vsg::Options>& options)
 {
     auto vertexShader = vsg::read_cast<vsg::ShaderStage>("shaders/csstandard.vert", options);
     auto fragmentShader = vsg::read_cast<vsg::ShaderStage>("shaders/csstandard_pbr.frag", options);

     if (!vertexShader || !fragmentShader)
     {
         vsg::fatal("pbr::makeShaderSet(...) could not find shaders.");
         return {};
     }
     auto hints = vsg::ShaderCompileSettings::create();
     hints->generateDebugInfo = RuntimeEnvironment::get()->generateShaderDebugInfo;
     auto shaderSet = vsg::ShaderSet::create(vsg::ShaderStages{vertexShader, fragmentShader}, hints);
...
You also need to use VSG 1.0.4 at a minimum. In CMakeLists.txt:
set(VSG_MIN_VERSION 1.0.4)
find_package(vsg ${VSG_MIN_VERSION} REQUIRED)
RenderDoc
Once your application is built, you need to run it from within RenderDoc and capture traces of the frames that interest you. Here I’m setting up for run of vsgCs:
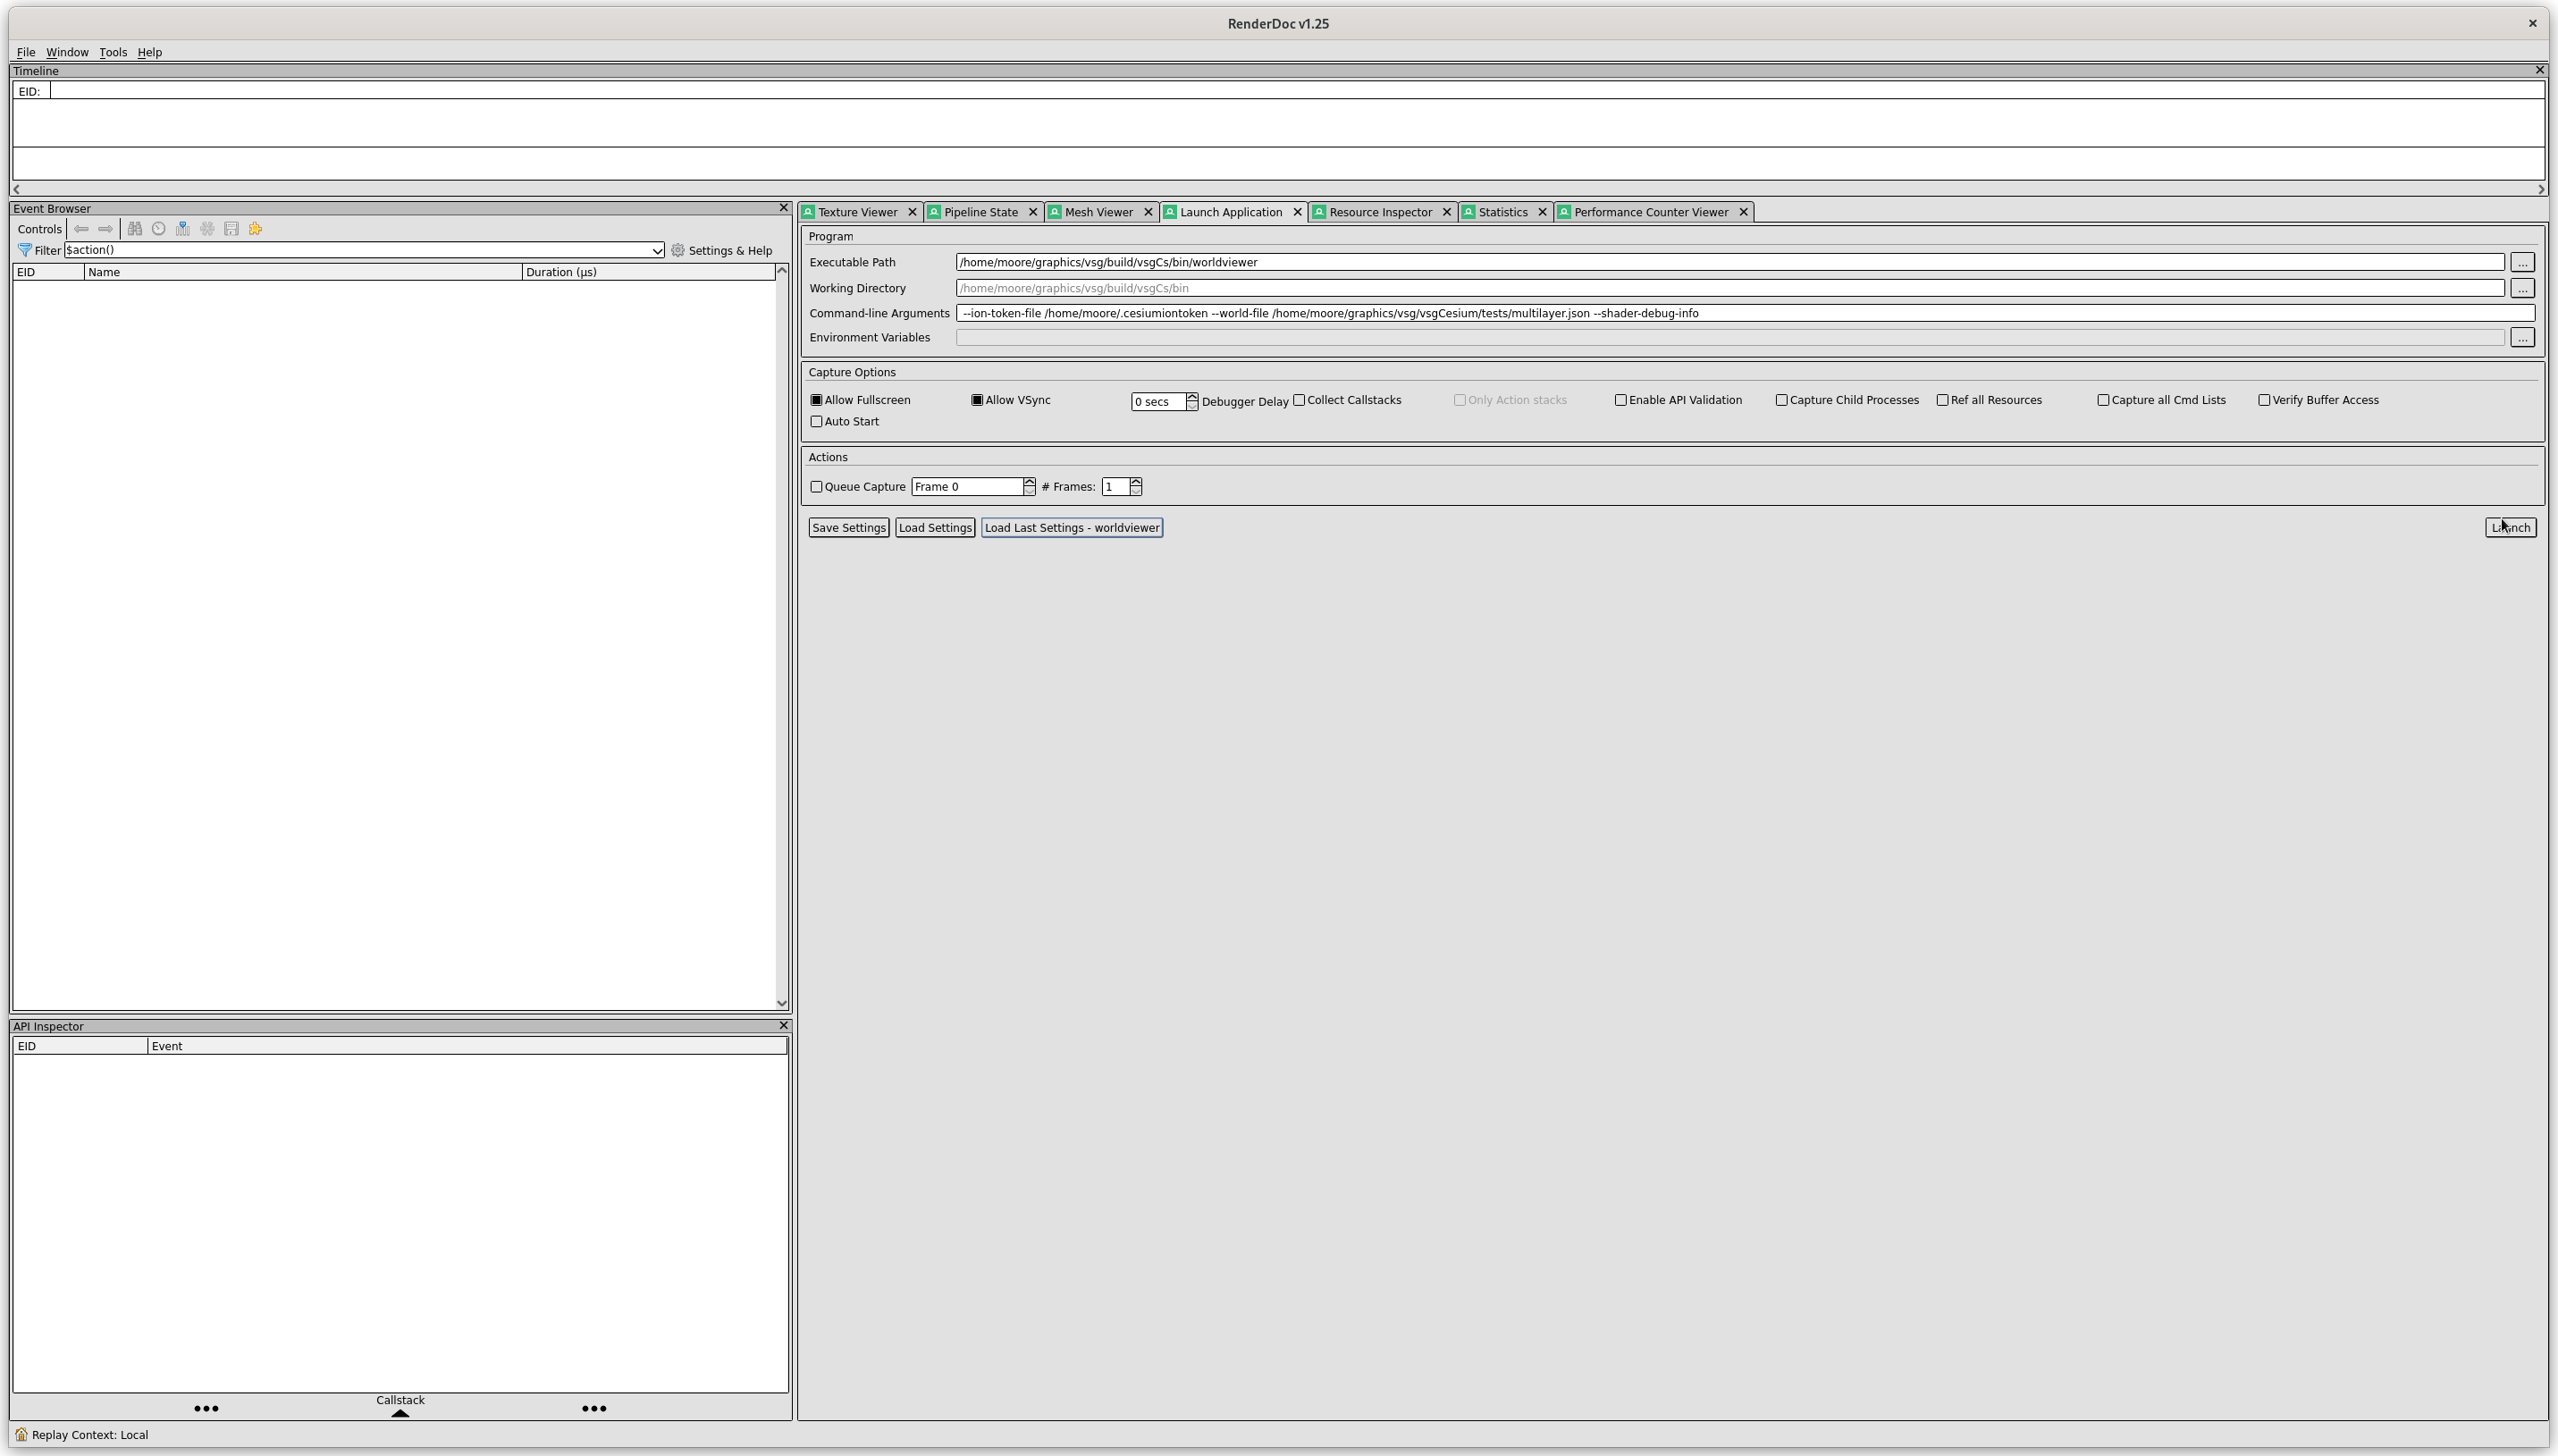
You can set program environment variables in this RenderDoc dialog,
but I prefer to do that in the shell where I launch the qrenderdoc
program.
Once you click on “launch,” RenderDoc will start the program with an
overlay providing simple statistics and instructions. Navigate to an
area of interest and press the F12 key to capture a frame’s events:
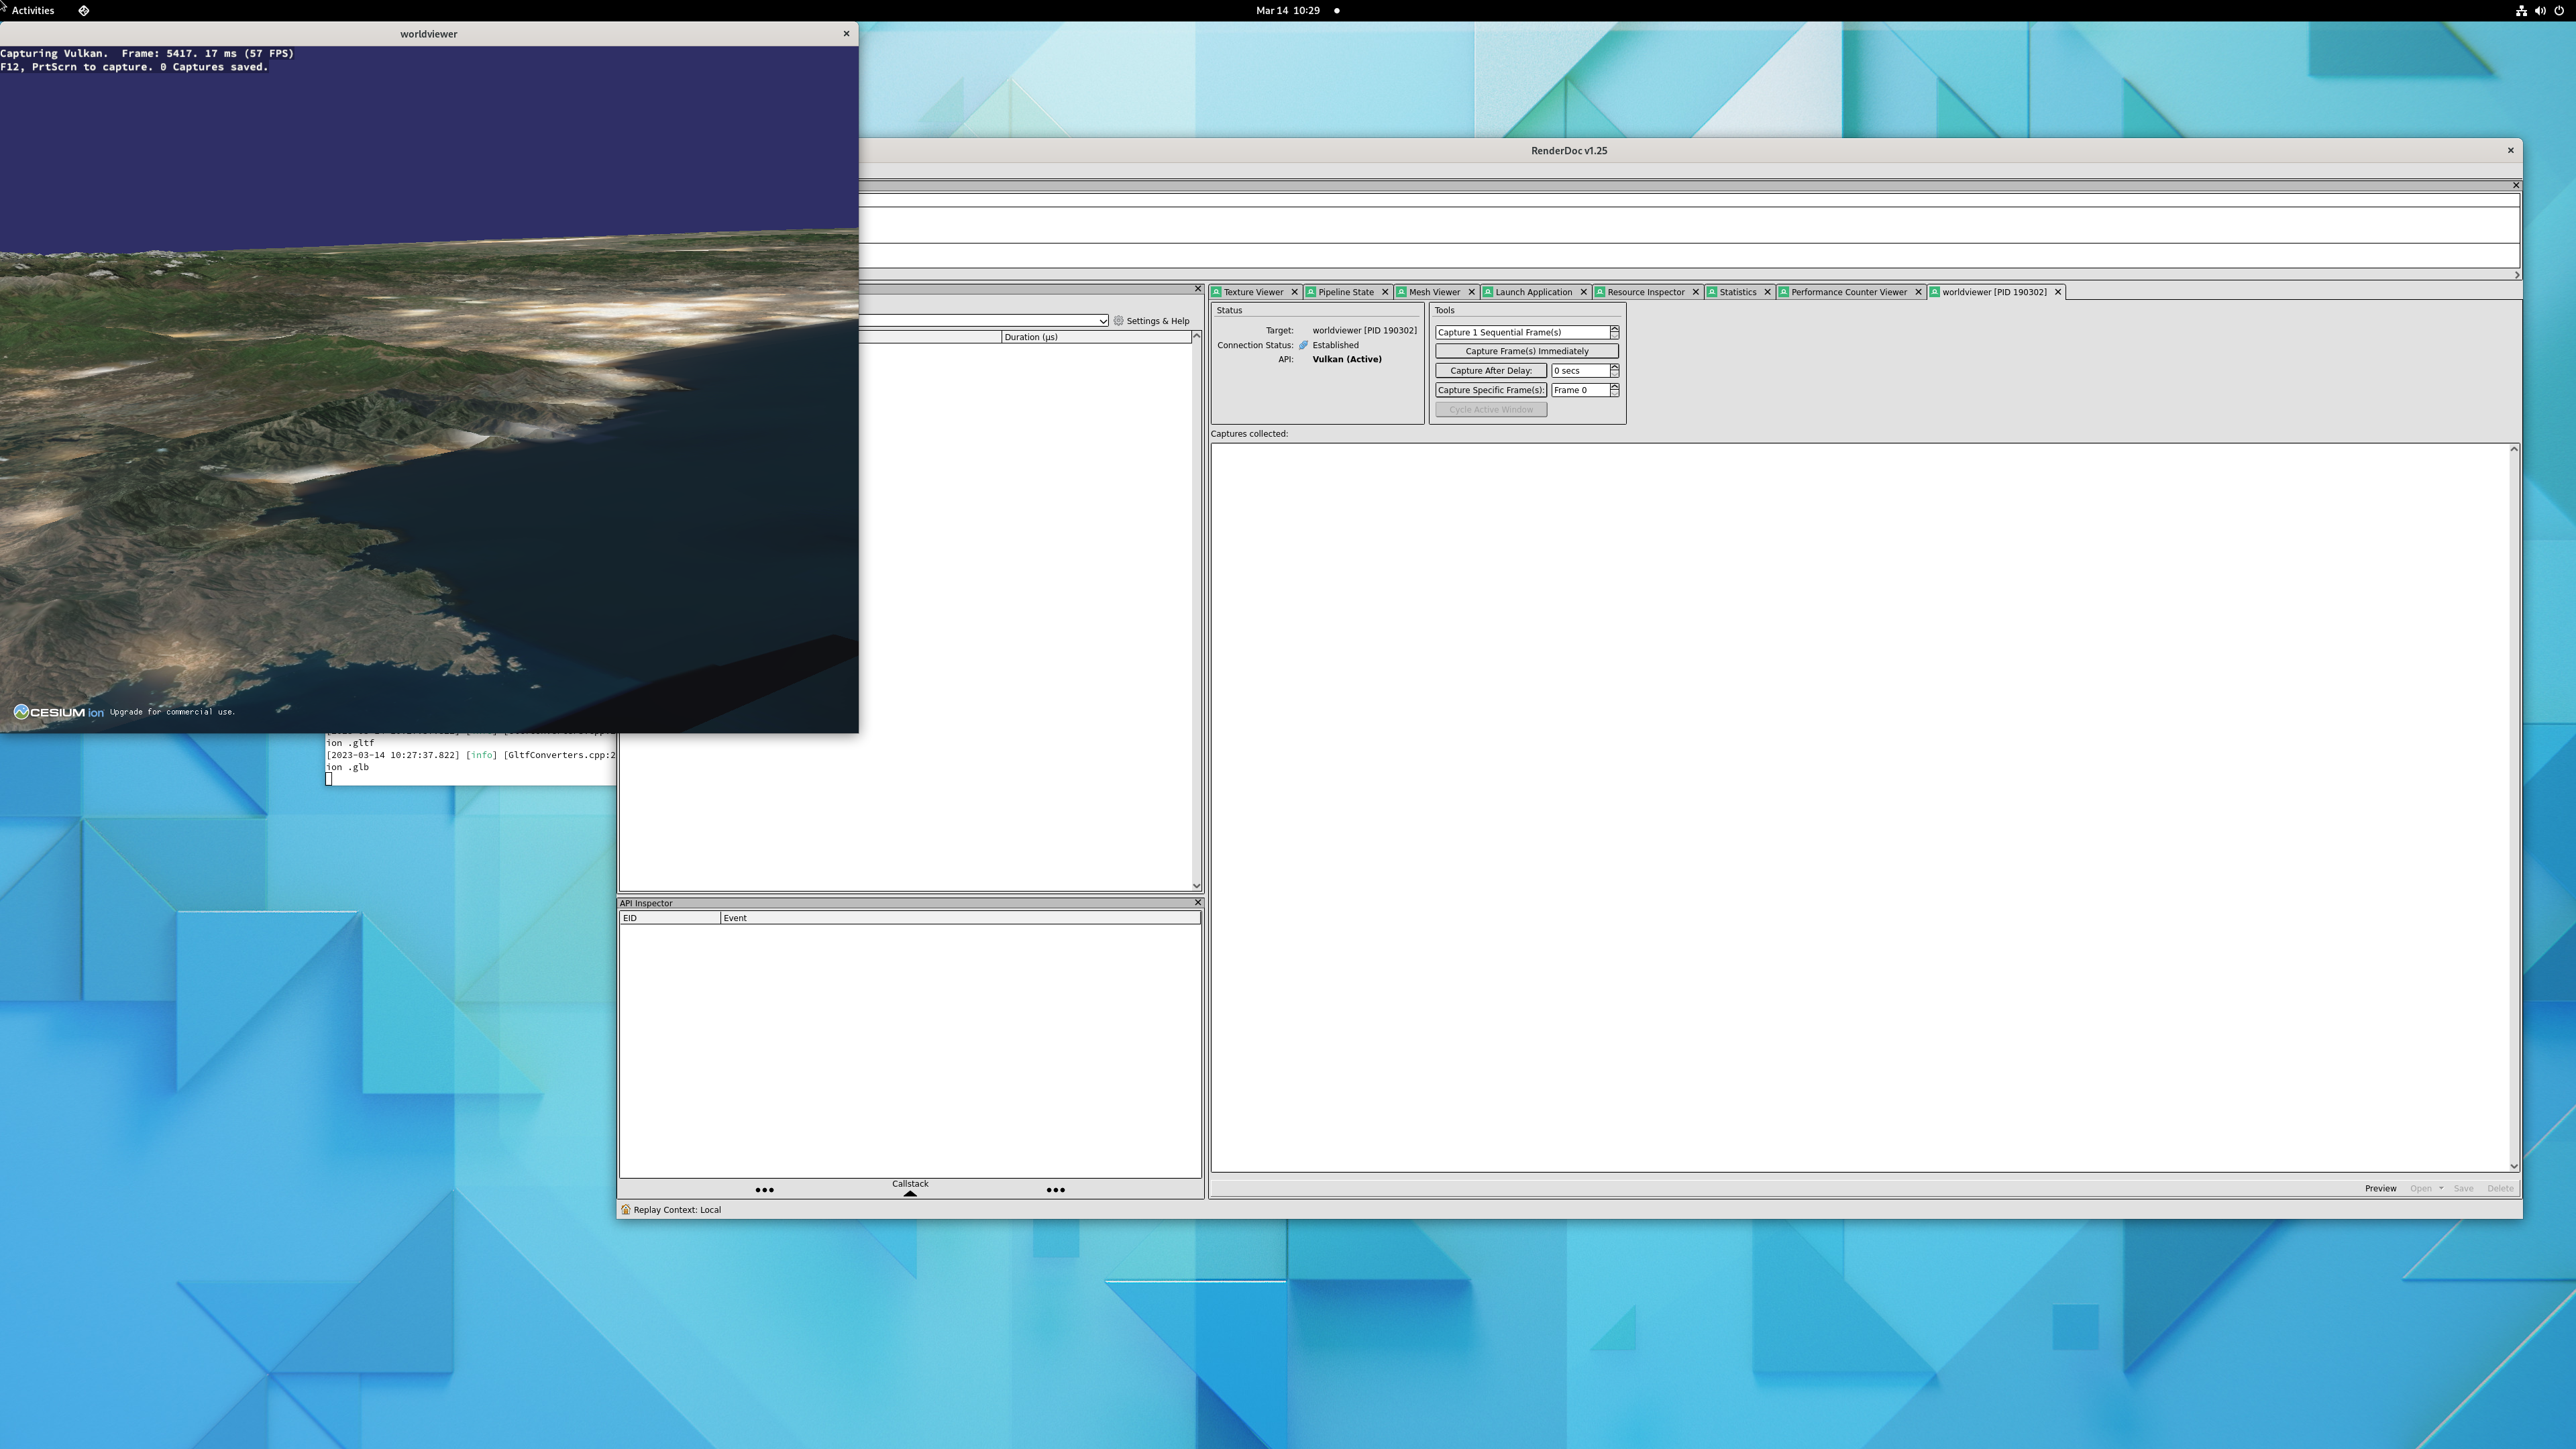
After we quit from the program, RenderDoc will load up the results of the capture:
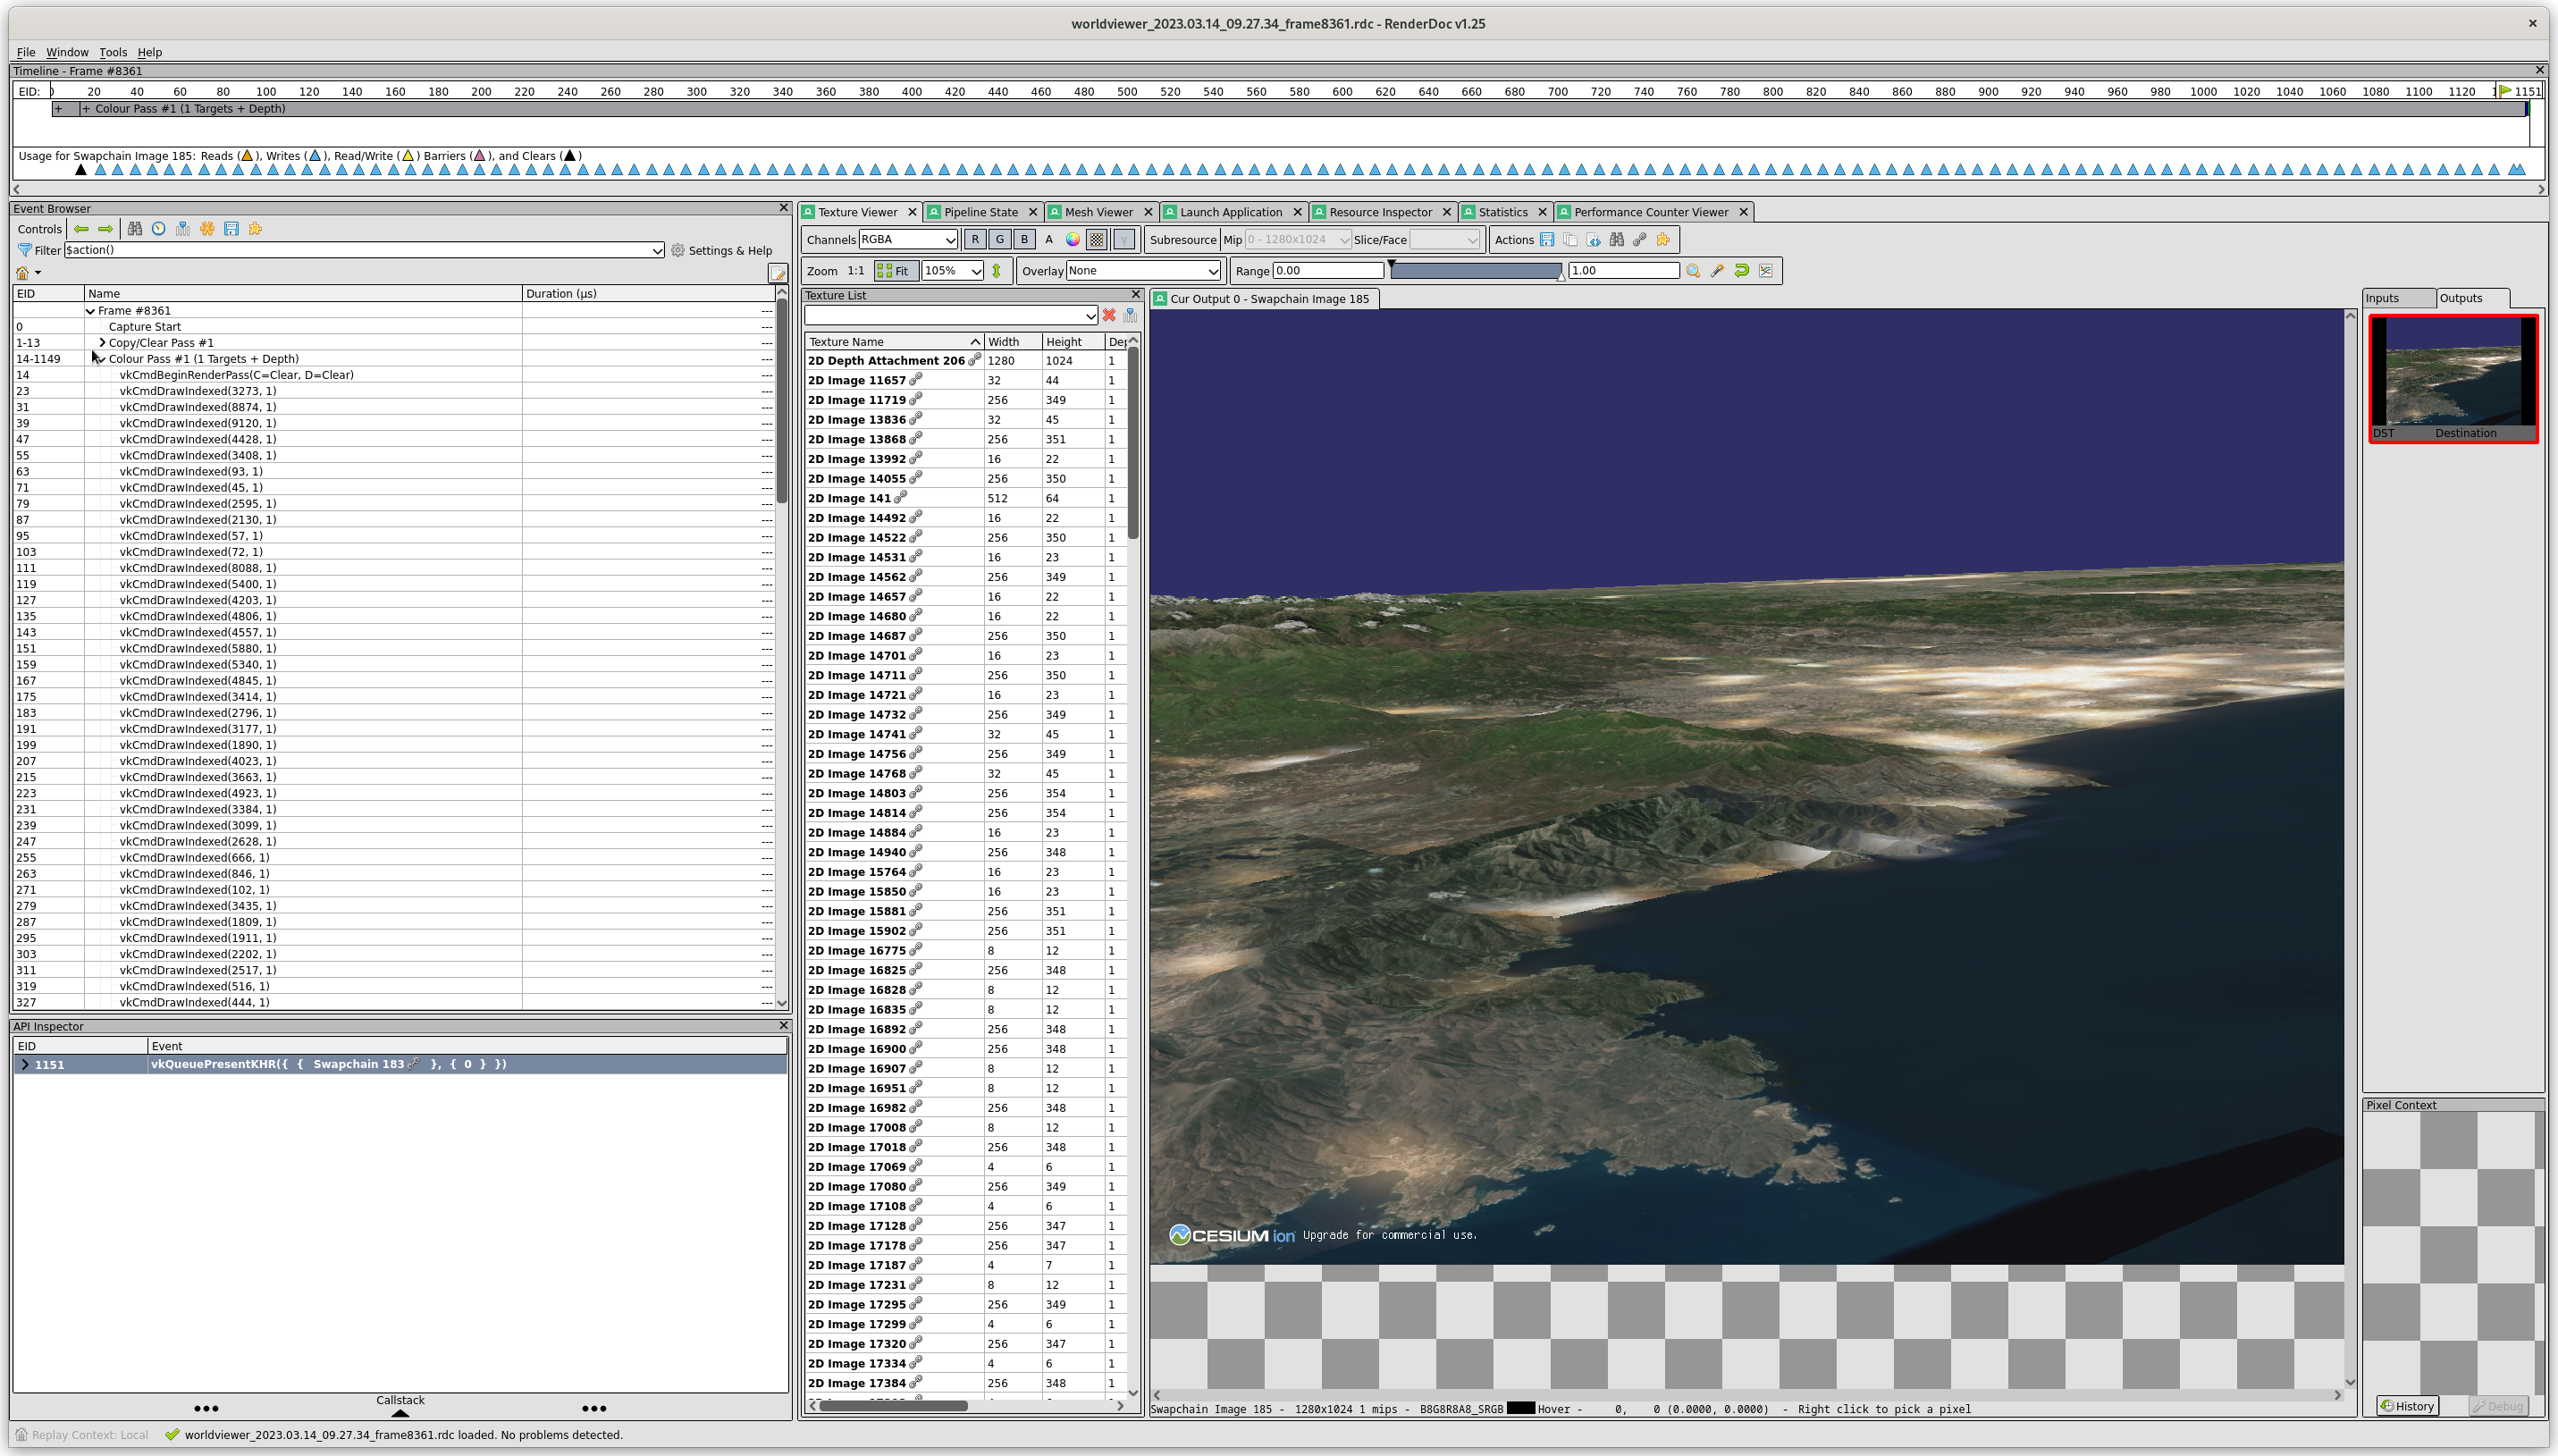
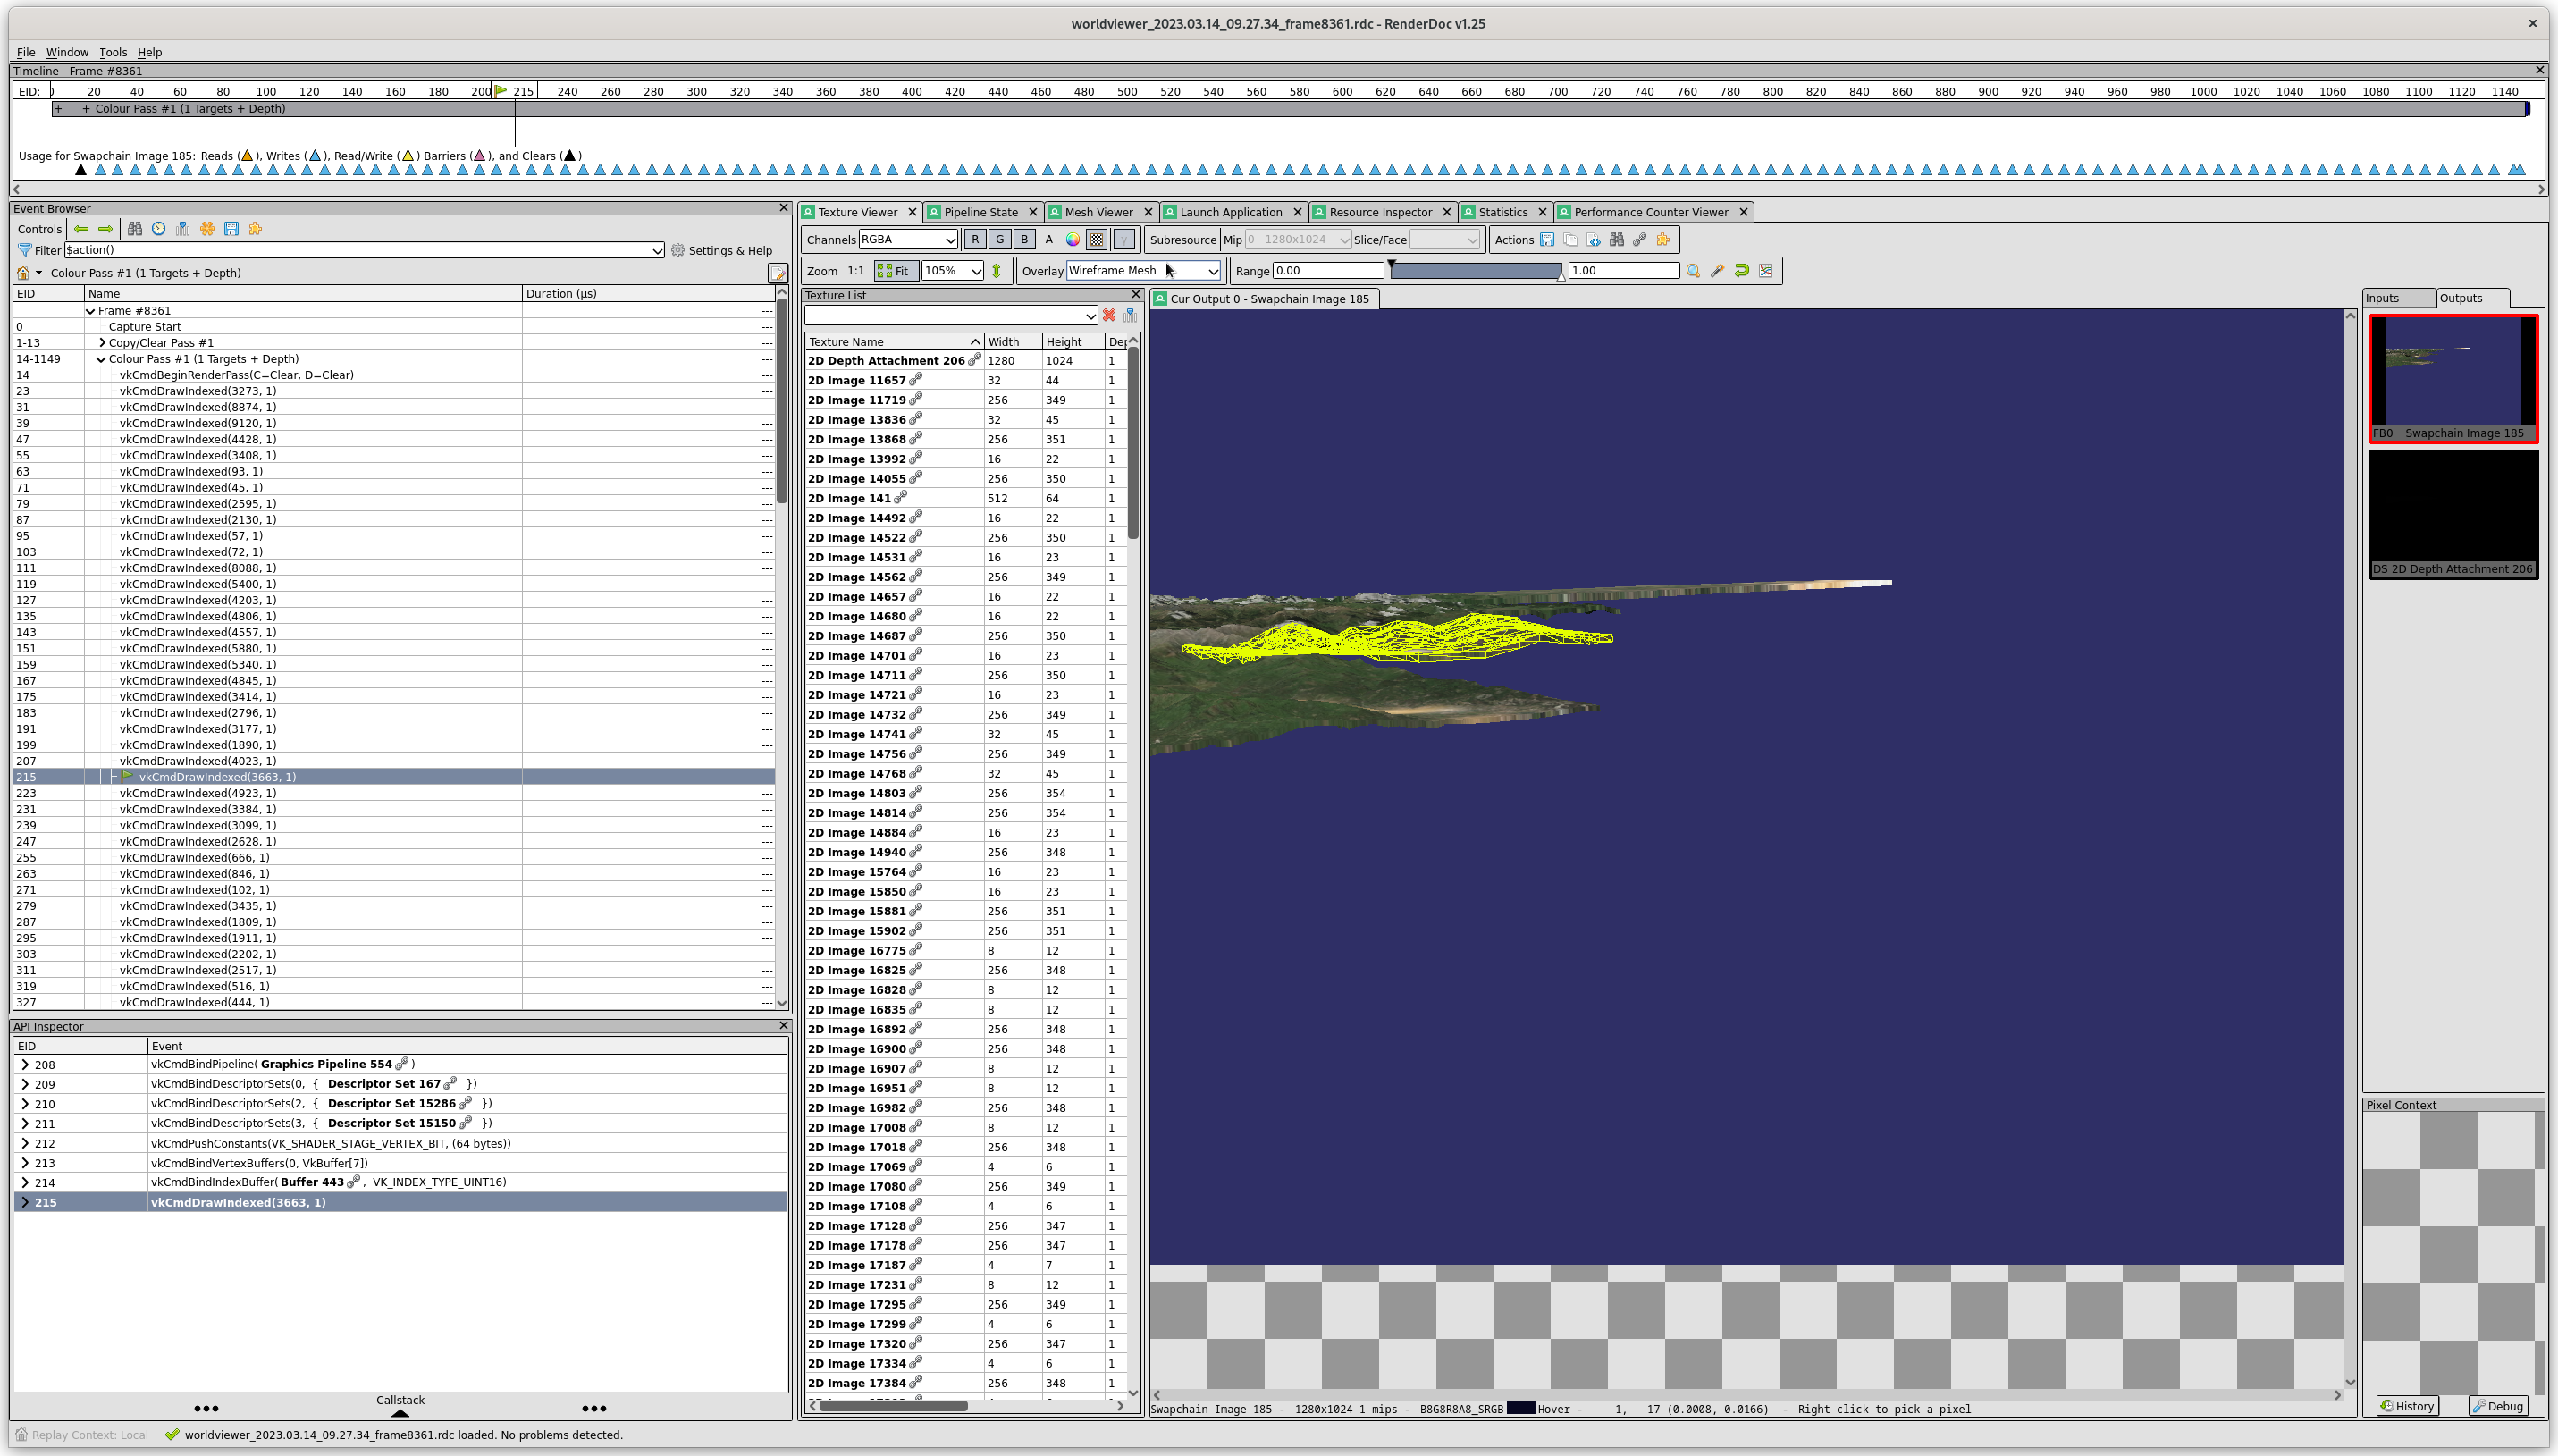
There is a lot going on here. On the left, RenderDoc displays a list of “important” Vulkan commands. We can drill down and see every command if we want, but that can quickly become overwhelming. If we click on a Draw event, we see the output after that draw command, as well as the other commands that affect the state of the command:
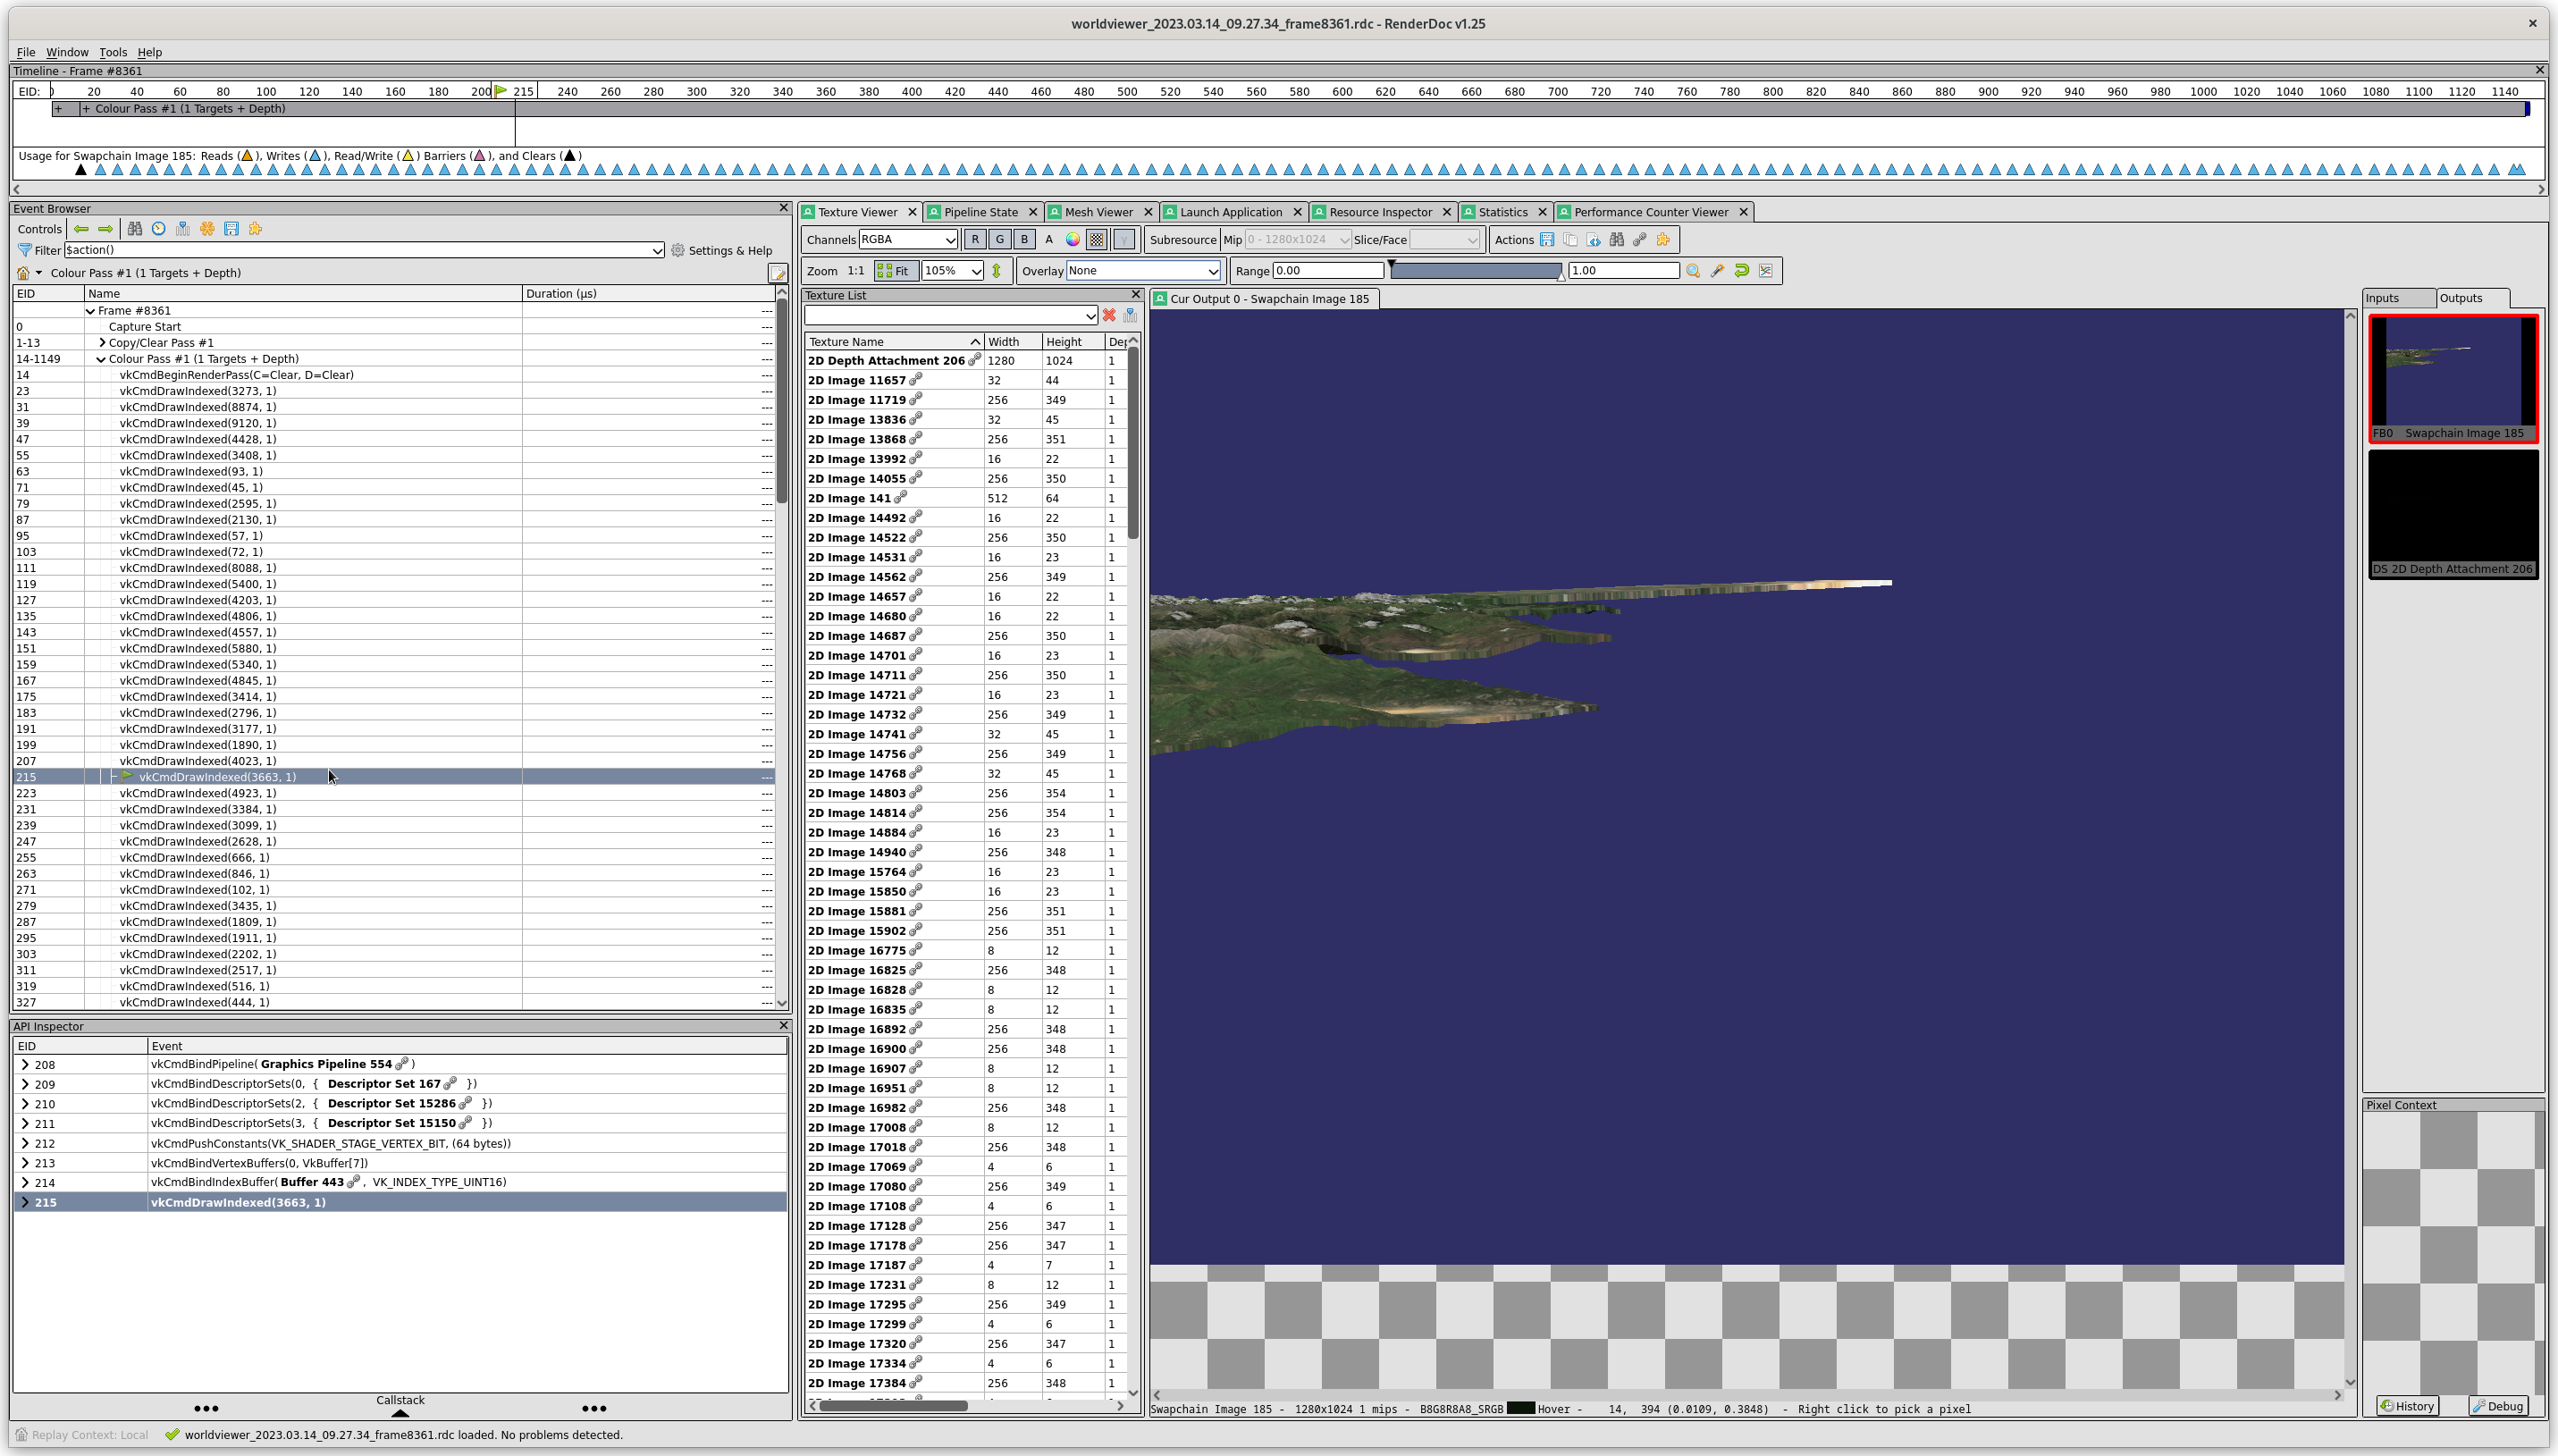
It’s not obvious what pixels were written by this draw command, but we can choose an overlay to show that:
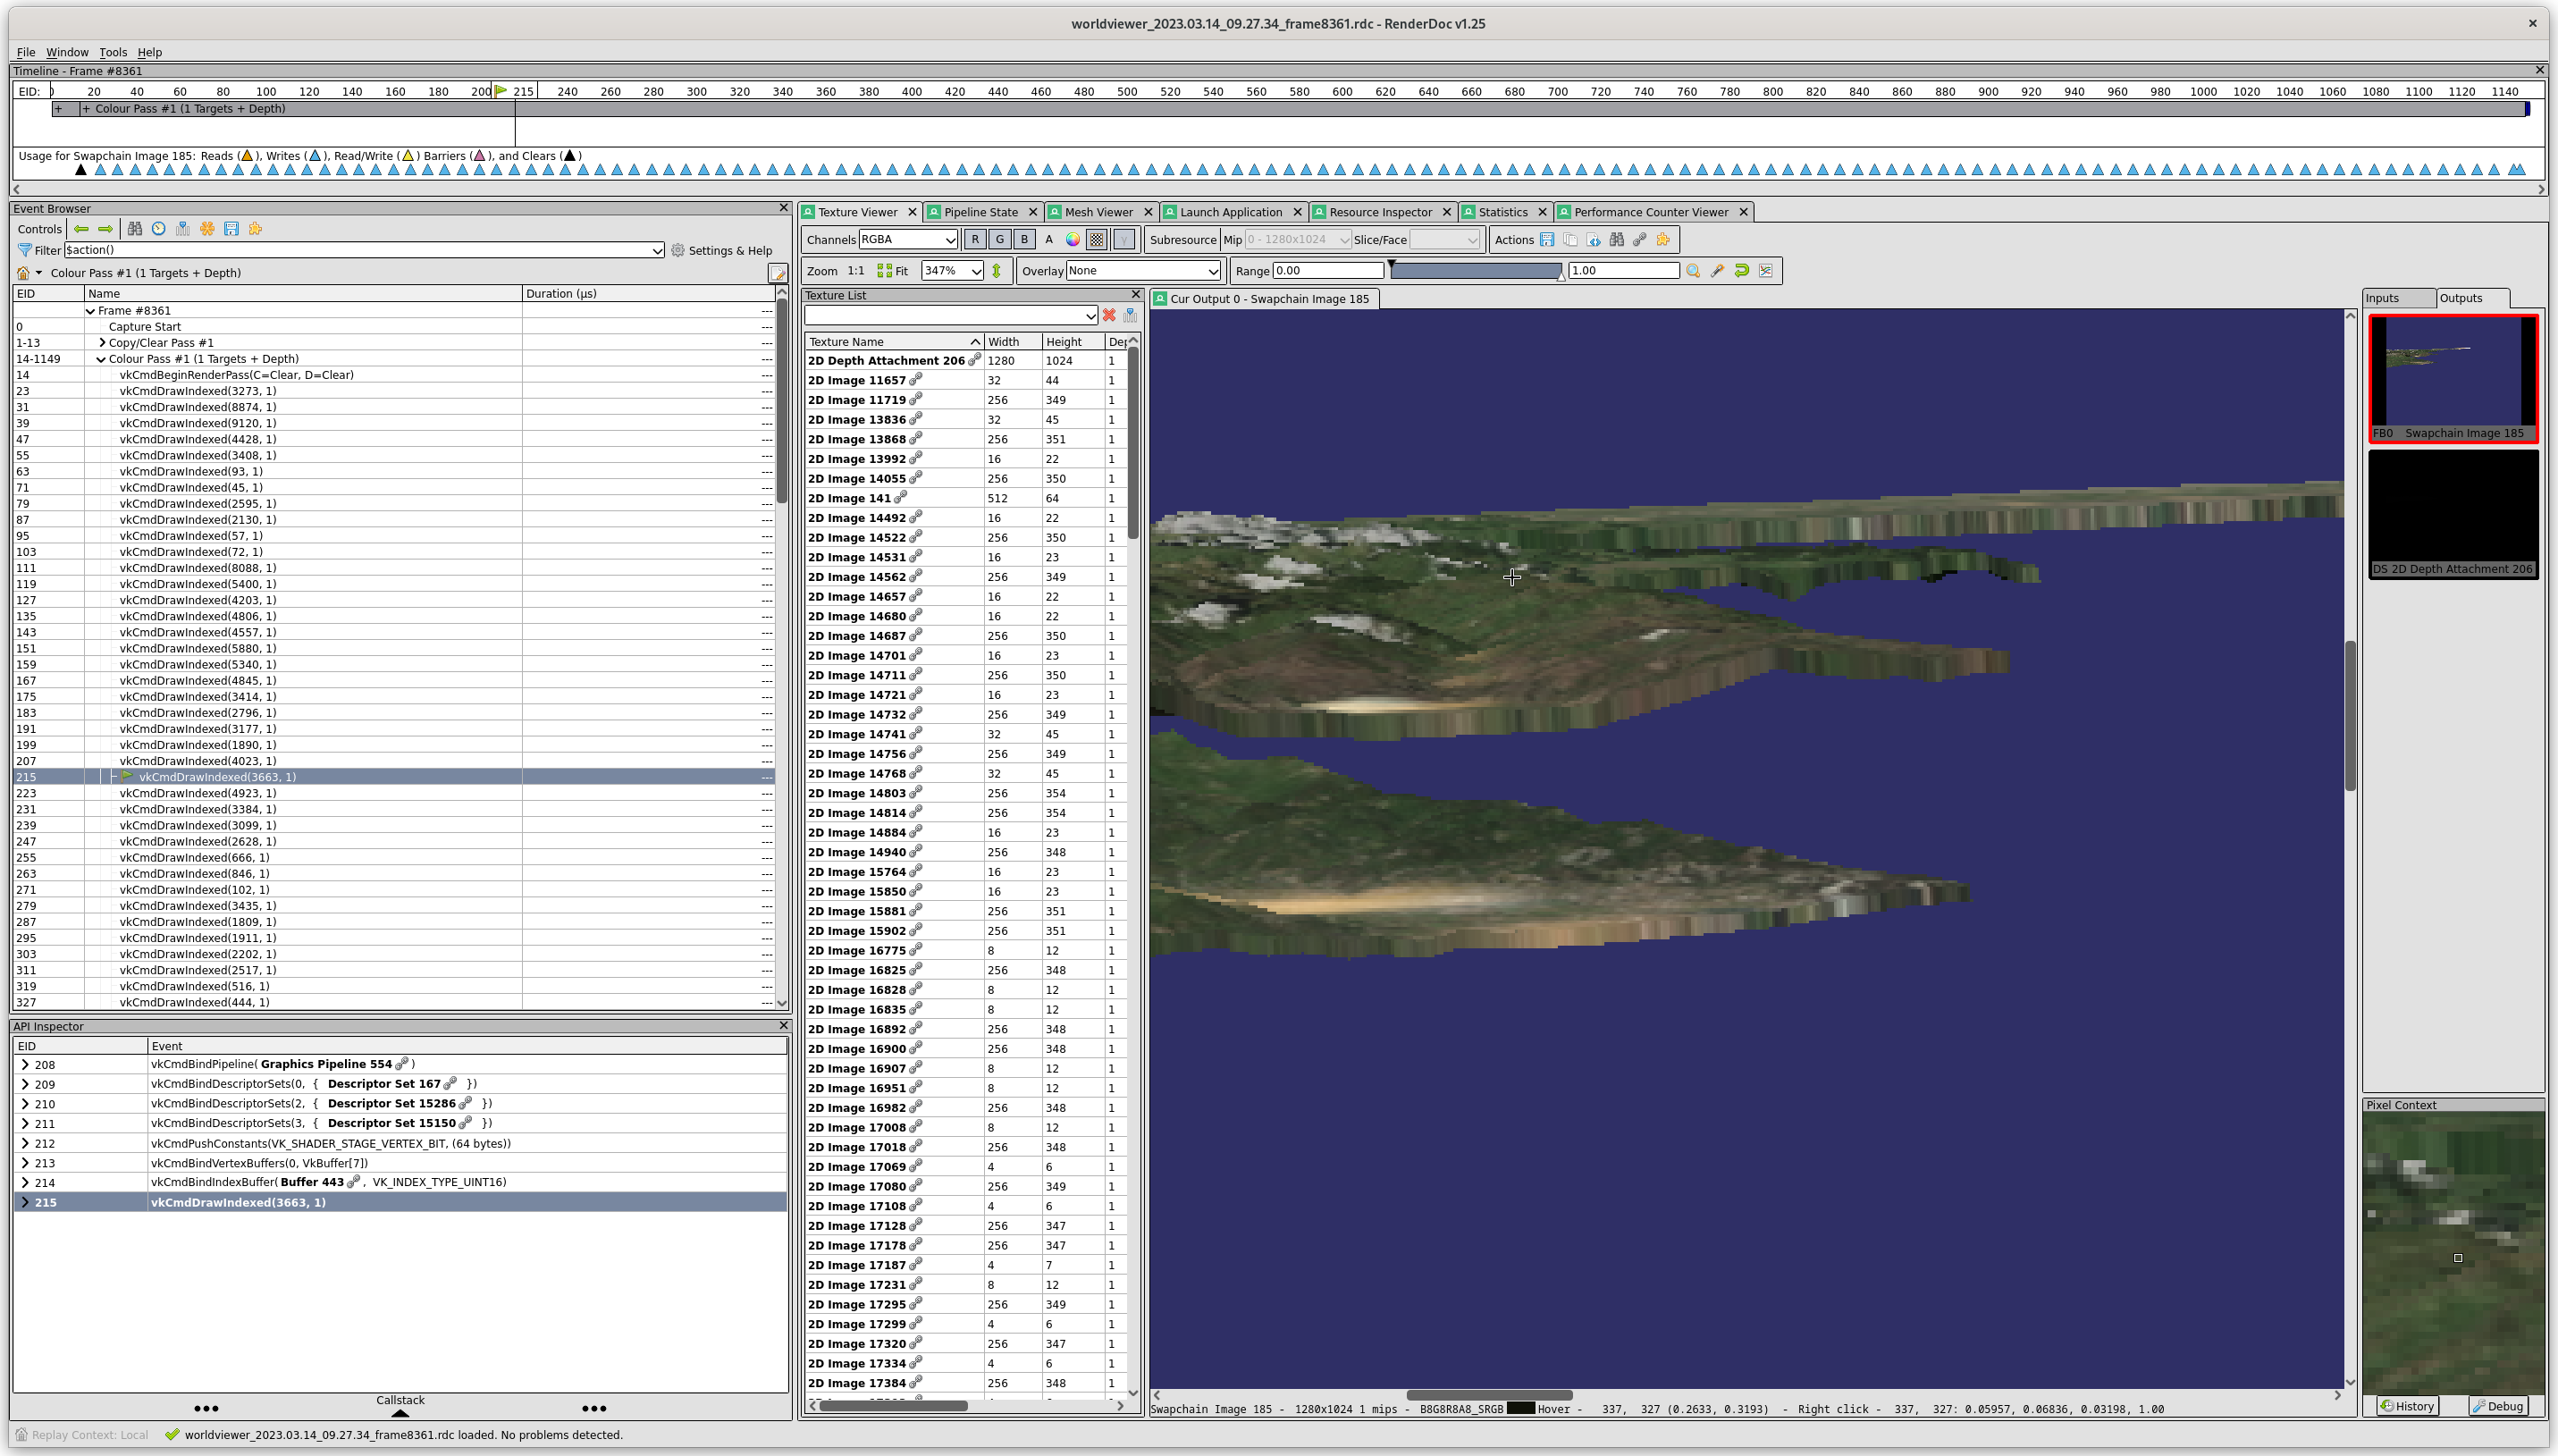
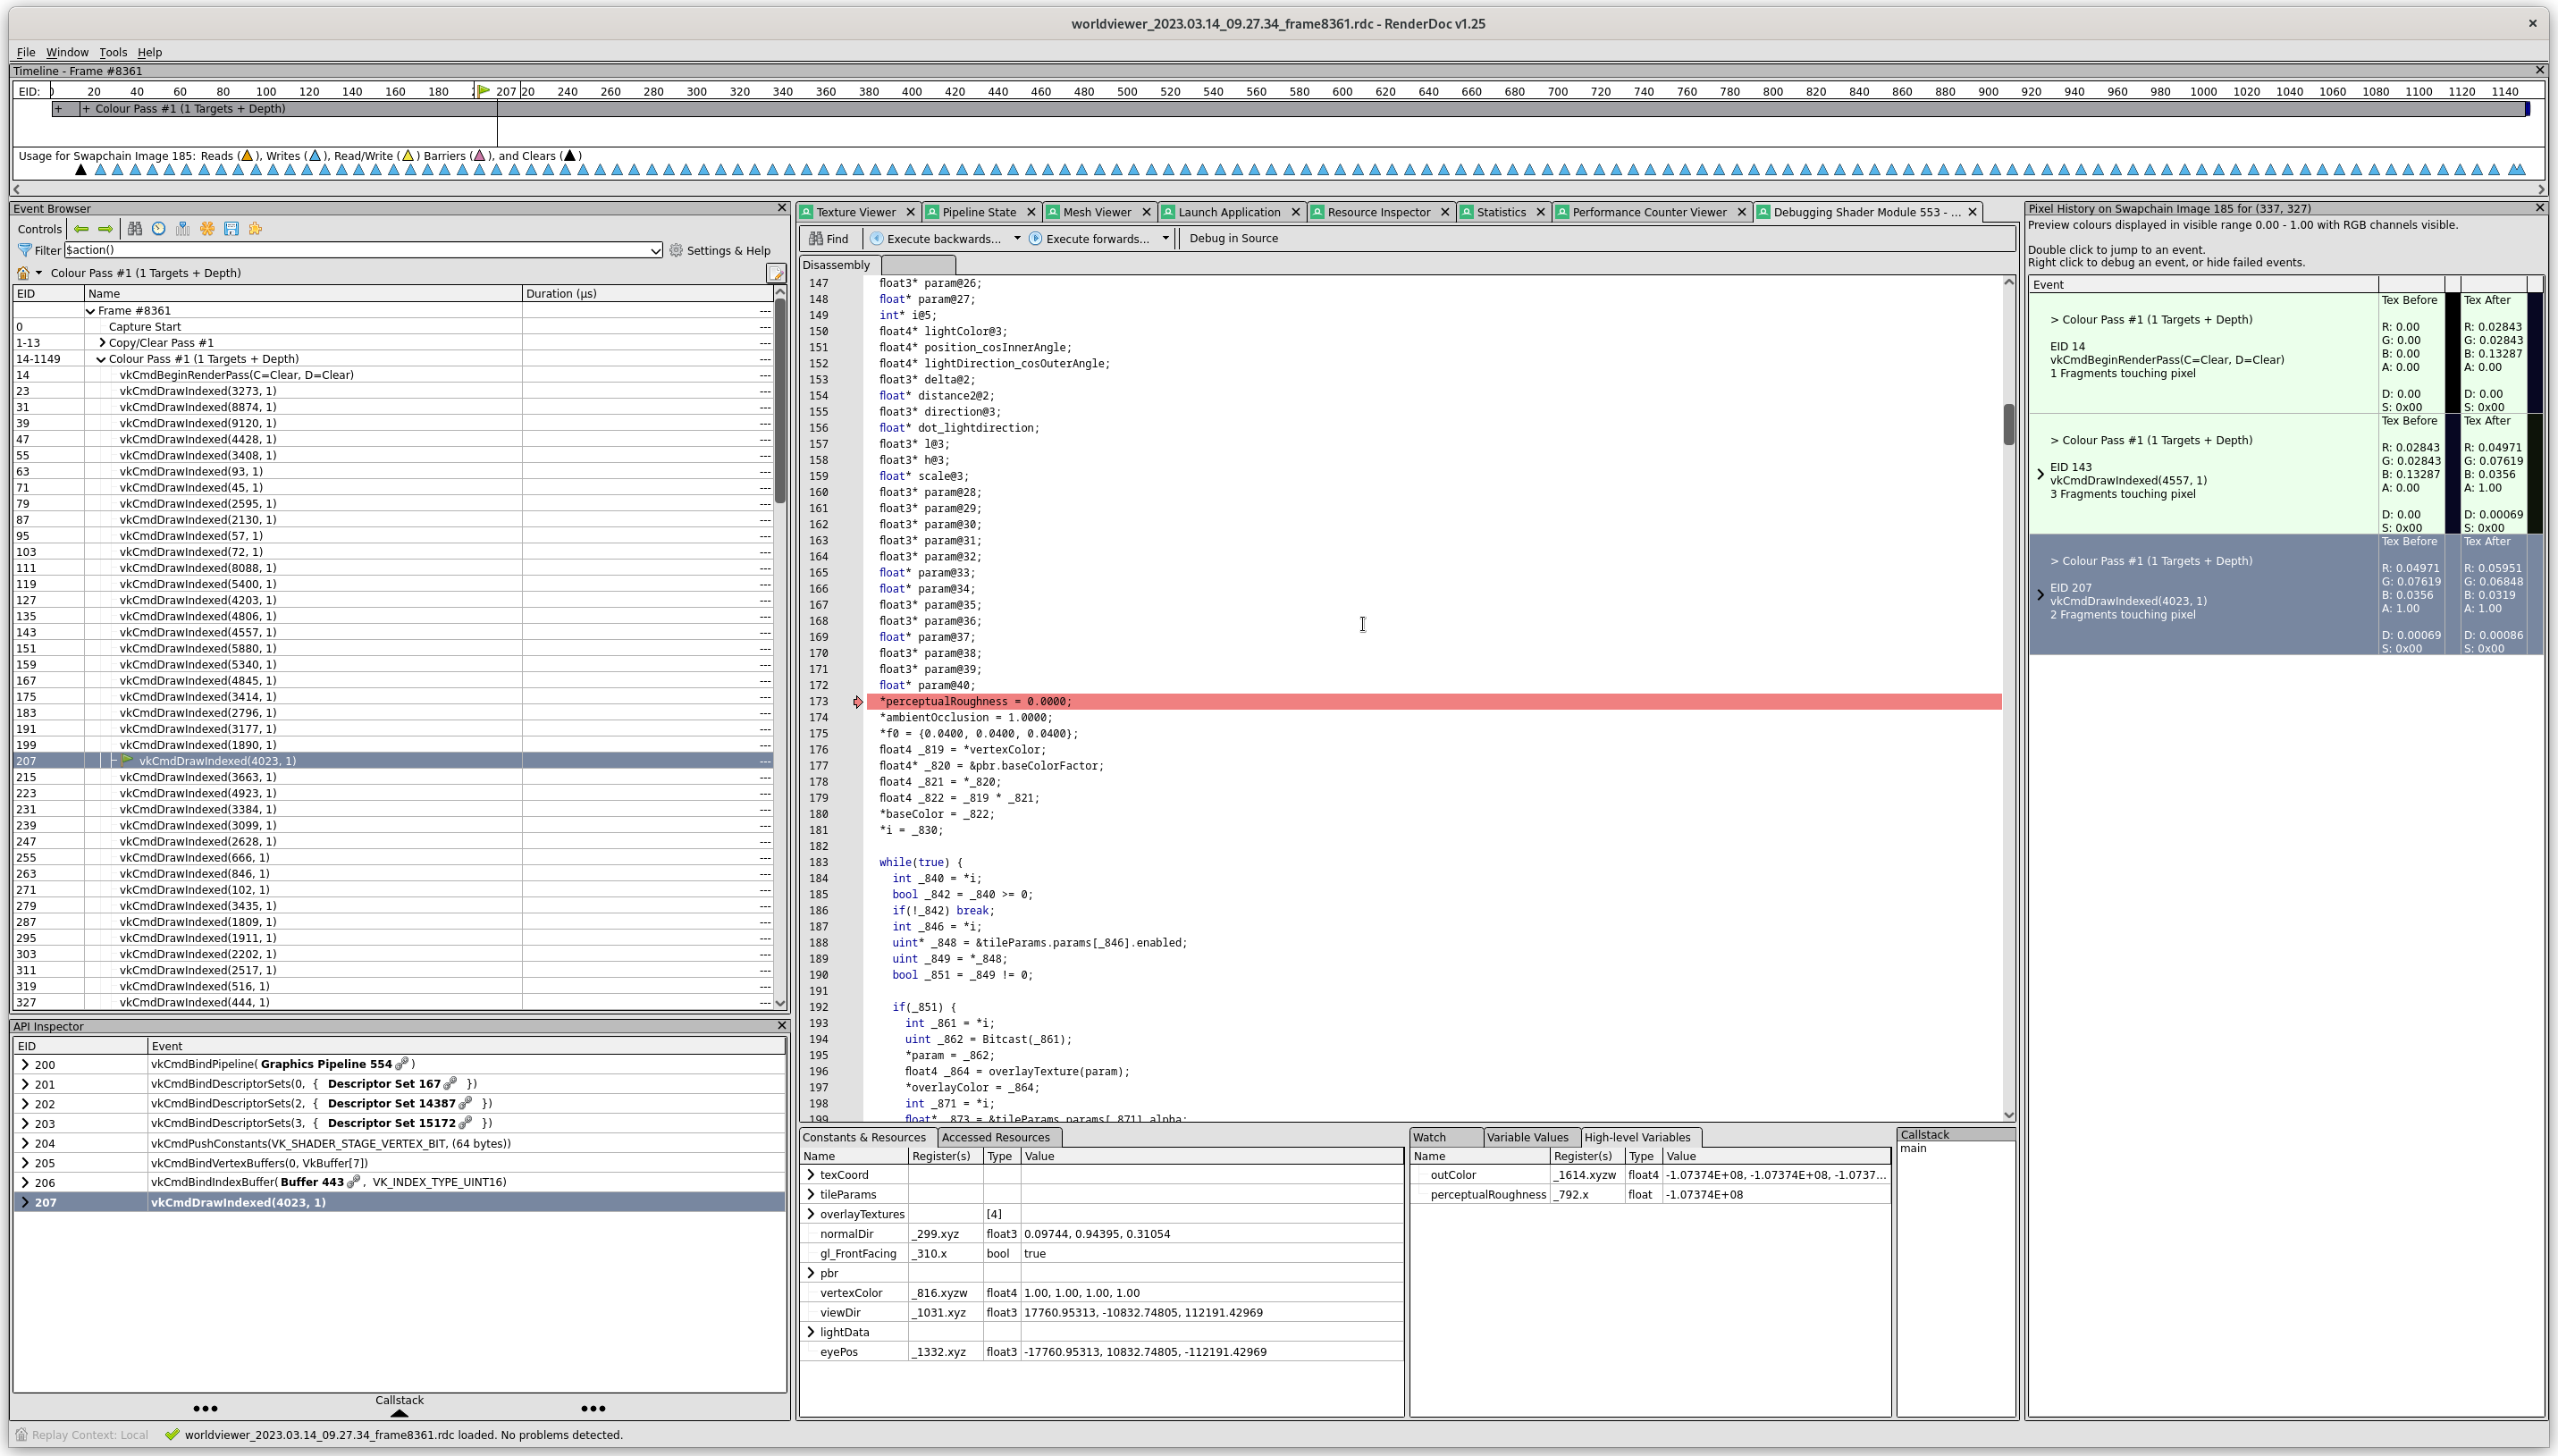
We zoom in with the thumbwheel and turn off the overlay. We can examine the status of an individual pixel by right-clicking on it. It’s neighborhood is now displayed in the “Pixel Context” window in the lower right:
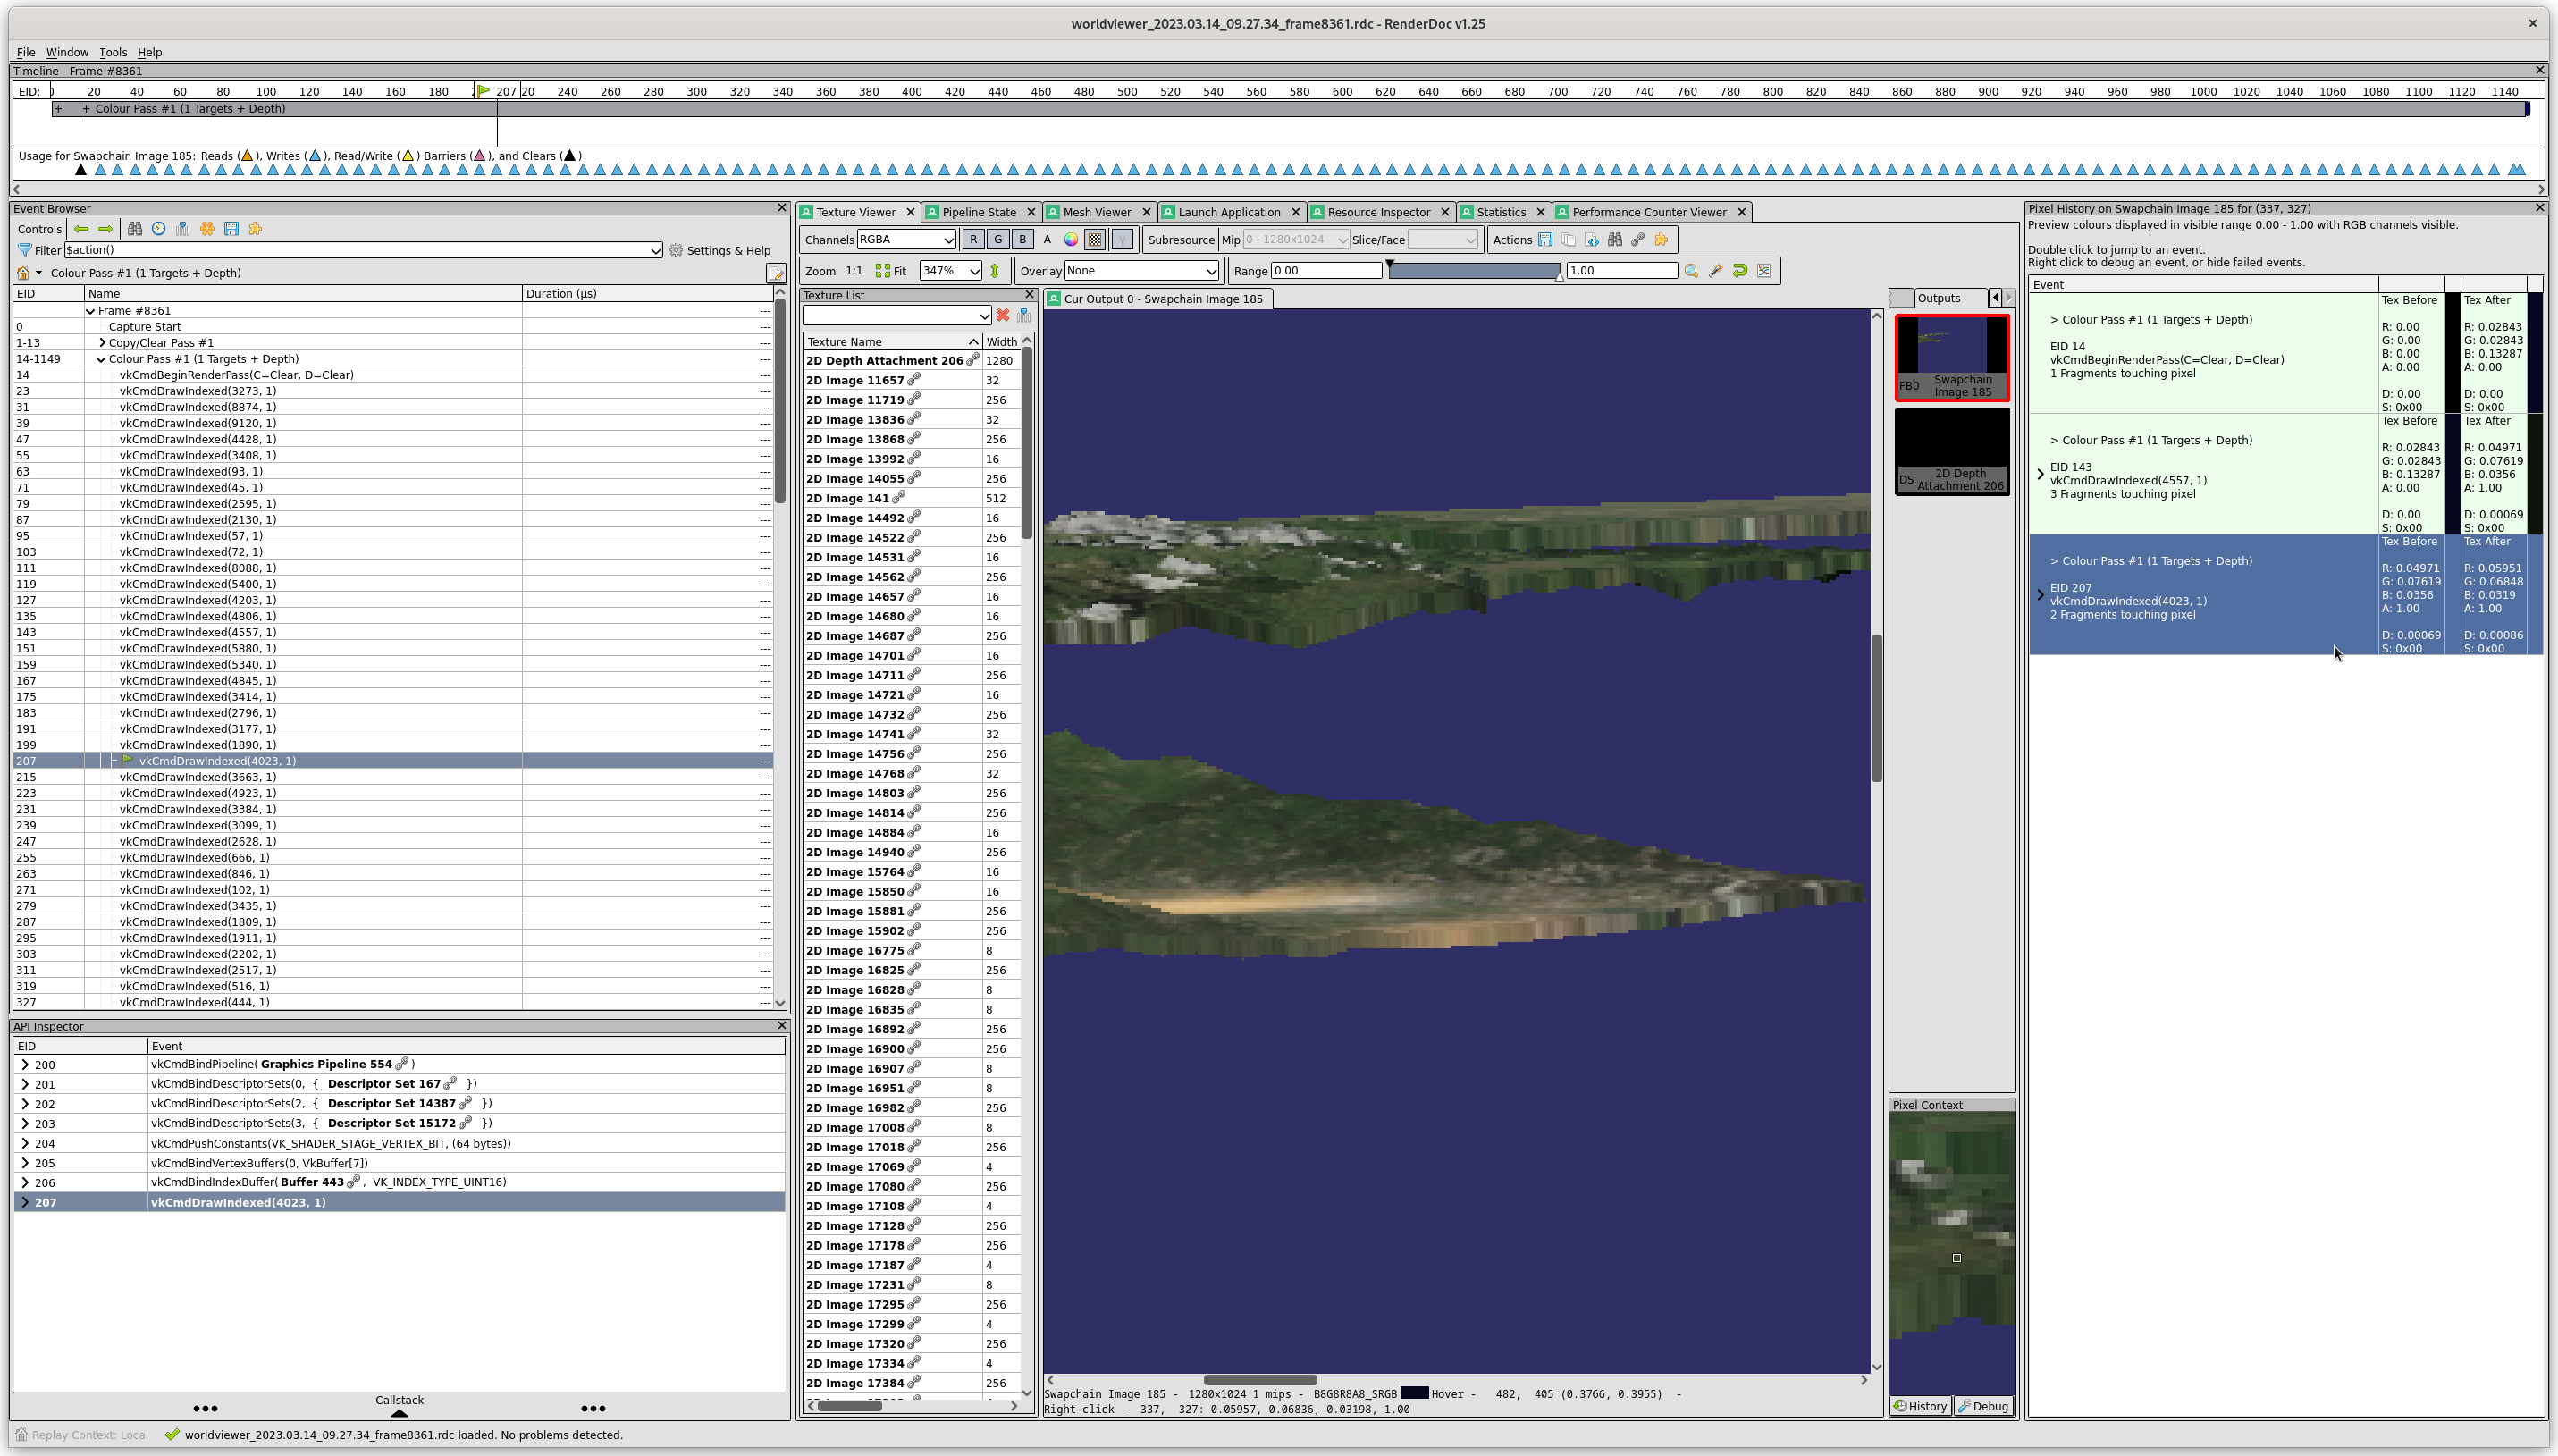
After clicking on the “Debug” tab of that window, we see a list of the events that touched that pixel, including the draw command, EID 207, that we were examining (note: not the draw command that’s highlighted; somehow I clicked on that, but it doesn’t matter):
![]()
In real life, we would probably start here: click on a pixel that doesn’t look right, figure out what draw call is responsible, and then start poking around. Now, we right click on this event and choose “Debug Pixel at EID 207” from the context menu:
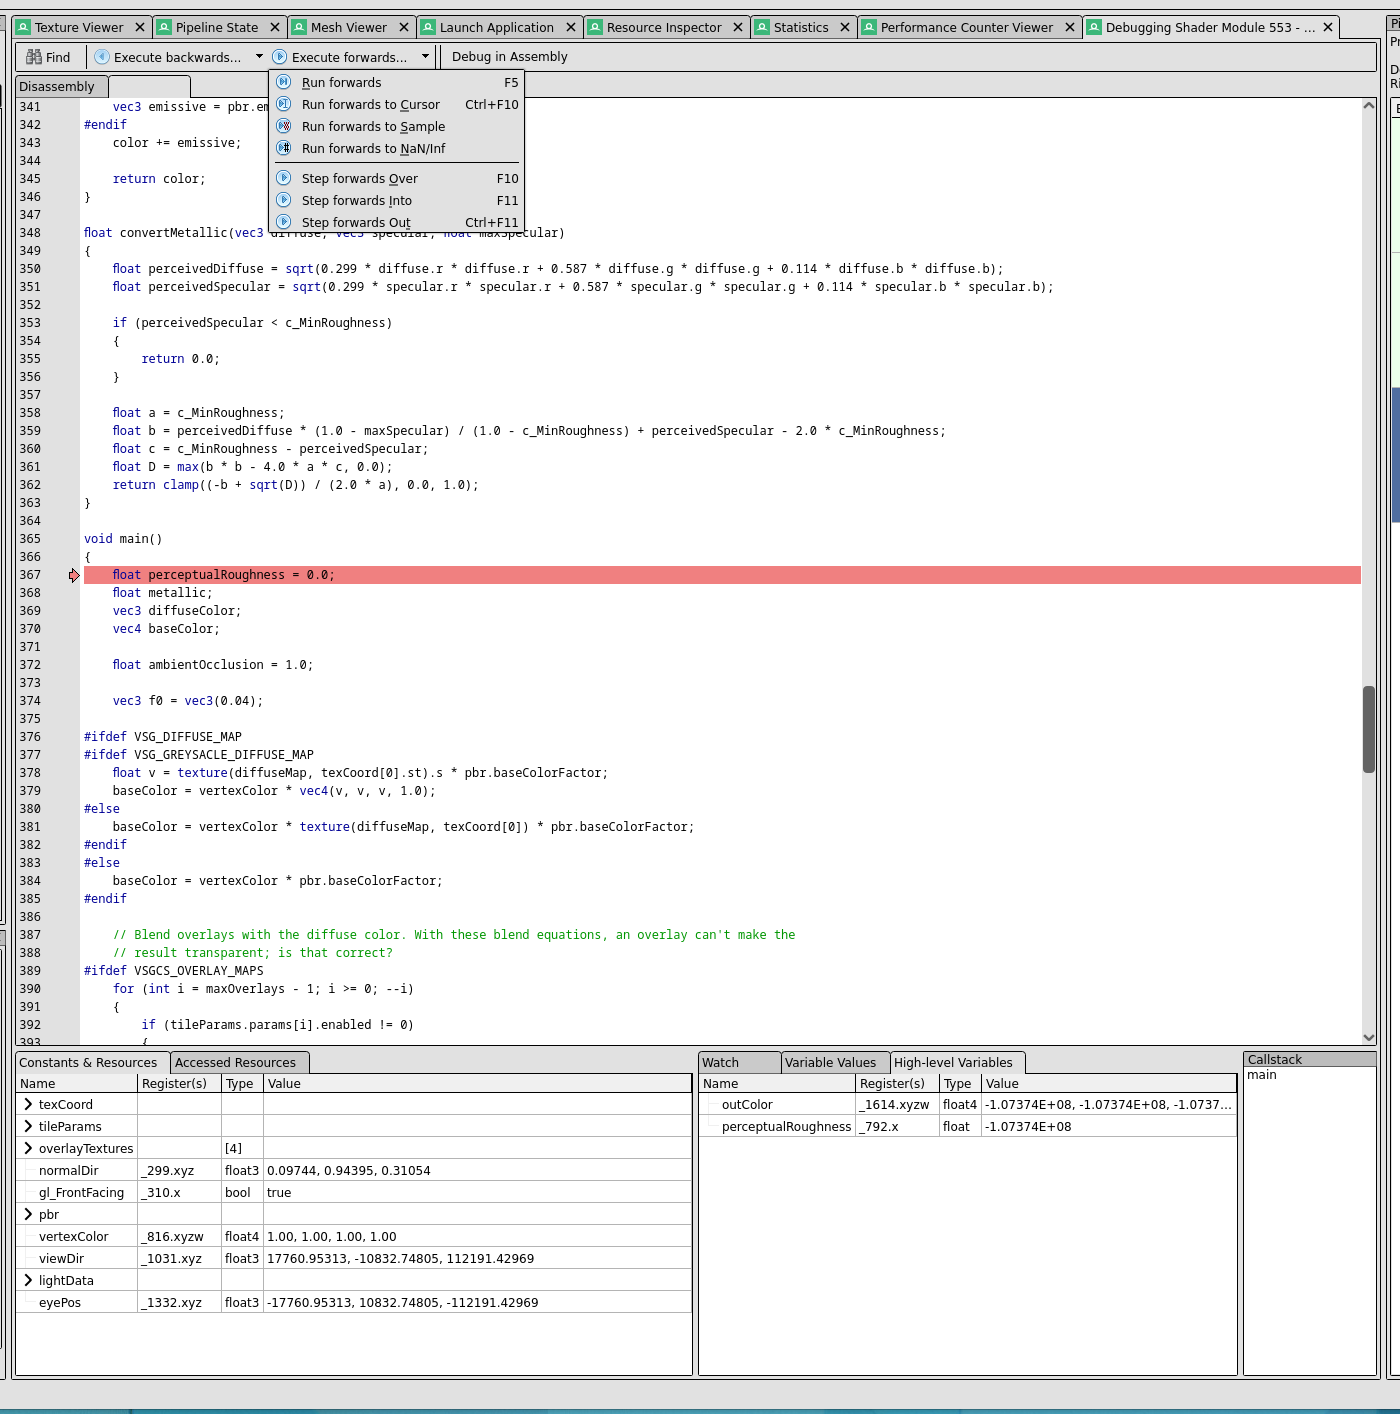
At that point, we are presented with the source code of the fragment shader that wrote the pixel, and we can run it again!
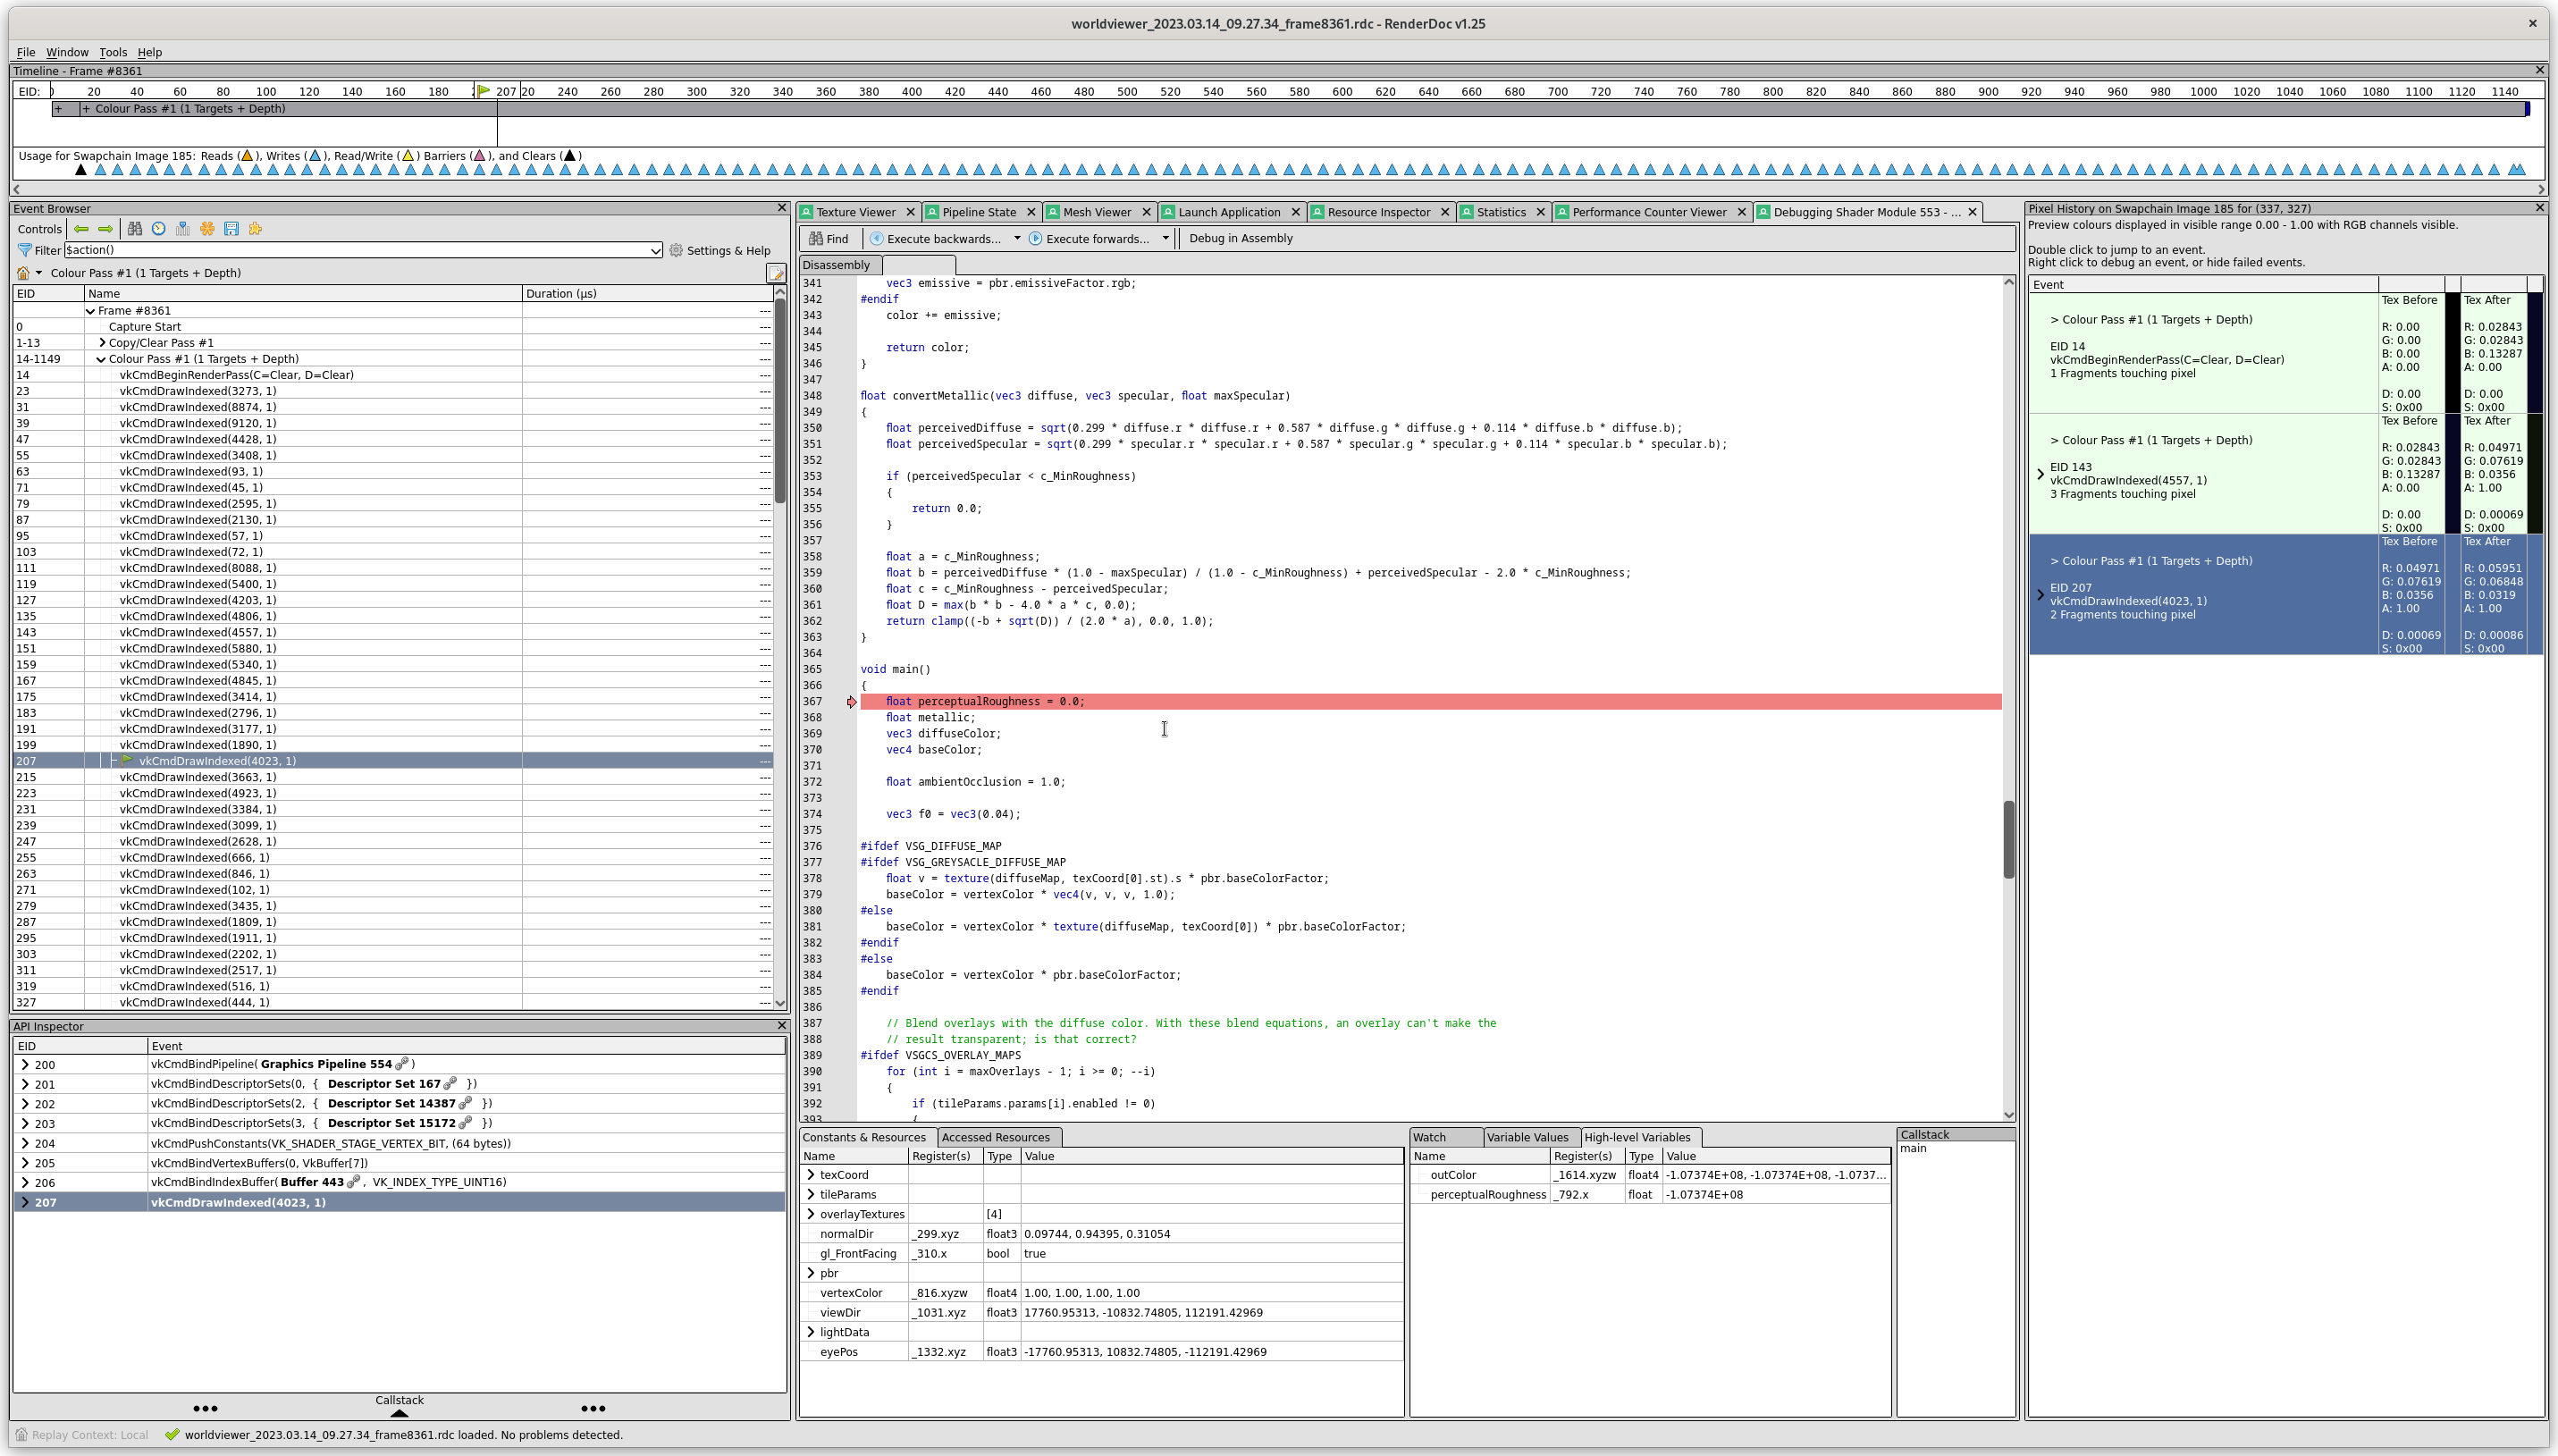
The environment is a bit like Microsoft Visual Studio. The values of variables are shown in the lower center window. We have a variety of commands for single stepping and running the program:
It should be noted that if we didn’t perform the initial steps to include the shader source, we could still debug the SPIR-V assembly code. This includes a lot of temporary variables, but the structure of the program and its named variables are still quite visible:
The experience isn’t too different from debugging an optimized C++ program that has been compiled with debugging symbols.